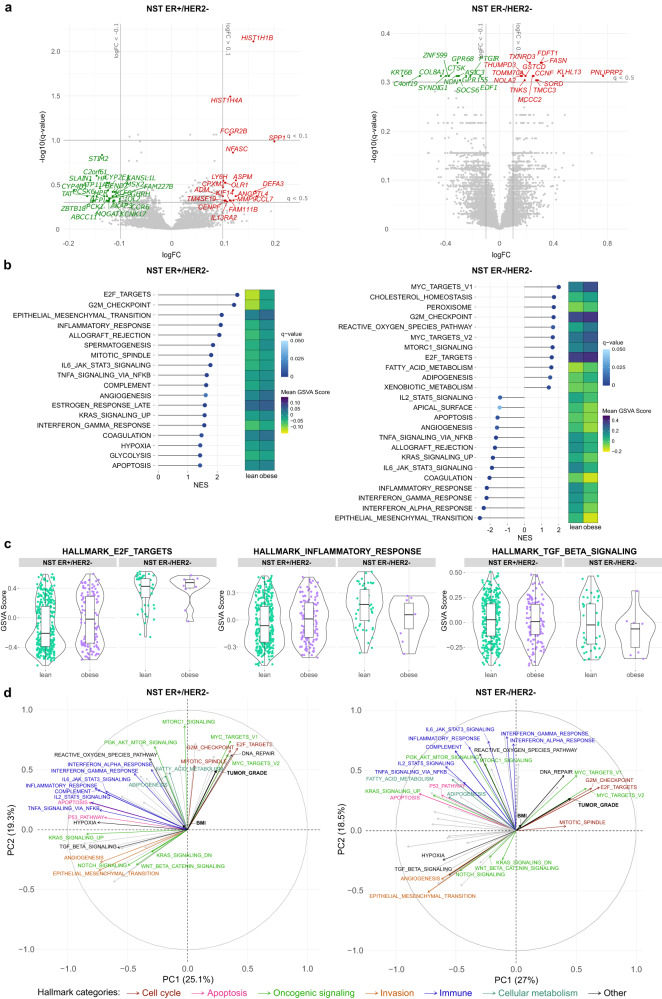
Fig. 4. Obesity-associated differences in the transcriptomic profile of primary breast cancer detected from the bulk profiling of tumors from the MINDACT cohort.
a Volcano plots showing differentially expressed genes (DEGs) comparing tumors from obese patients and those from lean patients. Gene expression data are presented as log10-ratio expression values. Genes with absolute log-fold change (logFC) > 0.1 and q value < 0.1 are colored and labeled (red: upregulated in tumors from obese patients, green: upregulated in tumors from lean patients). b Lollipop plots displaying differentially enriched molecular hallmarks according to BMI category (obese vs lean) detected by GSEA (q value < 0.1) and heatmap showing their corresponding average enrichment scores computed by gene set variation analysis (GSVA). The lengths of the lollipops represent the absolute values of the normalized enrichment scores (NES). The signs of the NES indicate the orientation of the differential enrichments (positive: enriched in tumors from obese patients, negative: enriched in tumors from lean patients). c Violin/box plots of GSVA scores of a cell cycle-related (E2F_TARGETS), an immune-related (INFLAMMATORY_RESPONSE), and a wound healing-related (TGF_BETA_SIGNALING) hallmark in NST ER+/HER2− (lean, n = 354; obese, n = 131) and NST ER−/HER2 tumors (lean, n = 53; obese, n = 11) from obese and lean patients. In each boxplot, the box denotes the range from the 25th to the 75th percentile, the center line indicates the median value, and the whiskers specify the maxima and minima excluding outliers. d Loadings of the fifty hallmarks, continuous BMI, and tumor grade on the first two principal components (PCs). The principal component analysis (PCA) was performed on a matrix consisting of rows representing patients in the BMI categories lean and obese, and columns representing the GSVA scores of the fifty hallmarks. The coordinates of the two clinical variables were then predicted based on the determined PCs. The angles between the vectors are informative of how they correlate with one another, and the lengths suggest the influence of the variables on this specific two-dimensional space. Hallmarks of importance in the context of cancer are labeled and colored according to their functional categories. Percentage of explained variability by each PC is reported in the axis label of the corresponding axis.

