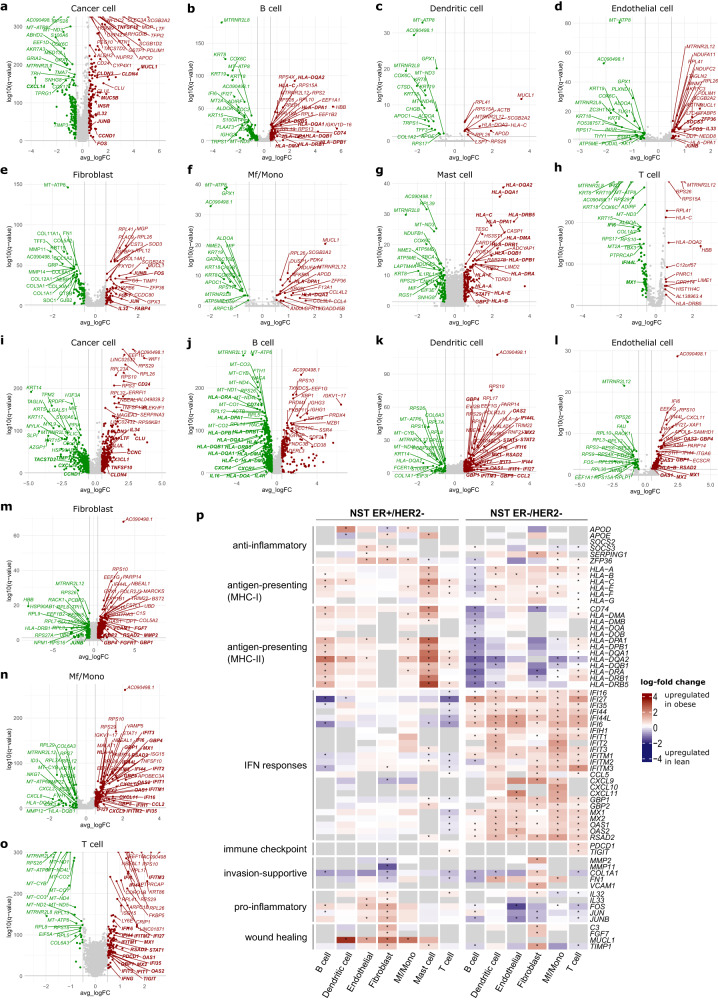
Fig. 5. Obesity-associated differences in the cell type-specific transcriptomic profile of primary breast cancer detected from the single-cell profiling of NST ER+/HER2− and NST ER−/HER2− tumors from the BioKey cohort.
a–h Volcano plots highlighting cell type-specific differentially expressed genes (DEGs) in eight cell types between obese and lean patients in the NST ER+/HER2− subgroup. Genes with absolute log2-fold change (logFC) > 0.5 and q value < 0.05 are colored (red: upregulated in cancer cells from obese patients, green: upregulated in cancer cells from lean patients). The top 20 upregulated (sorted by q value), 20 downregulated genes, and genes discussed in the main text (in bold) are labeled. i–o Companion plots of (a–h) for the NST ER−/HER2− subtype. Mast cells were excluded from the analyses for this subtype due to low absolute cell counts. p Heatmaps showing differential expression of a selection of genes involved in several immune and cancer pathways in non-malignant cell populations. The cell color is scaled based on the log-FC values (obese vs lean) estimated by the MAST test. Gray cells indicate genes not being tested due to expression in less than 10% of the corresponding cell type in both BMI categories. p values shown were adjusted for multiple testing using the Benjamin–Hochberg method (presented as q values). *, q value < 0.05. MHC-I, major histocompatibility complex class I; MHC-II, MHC class II.

