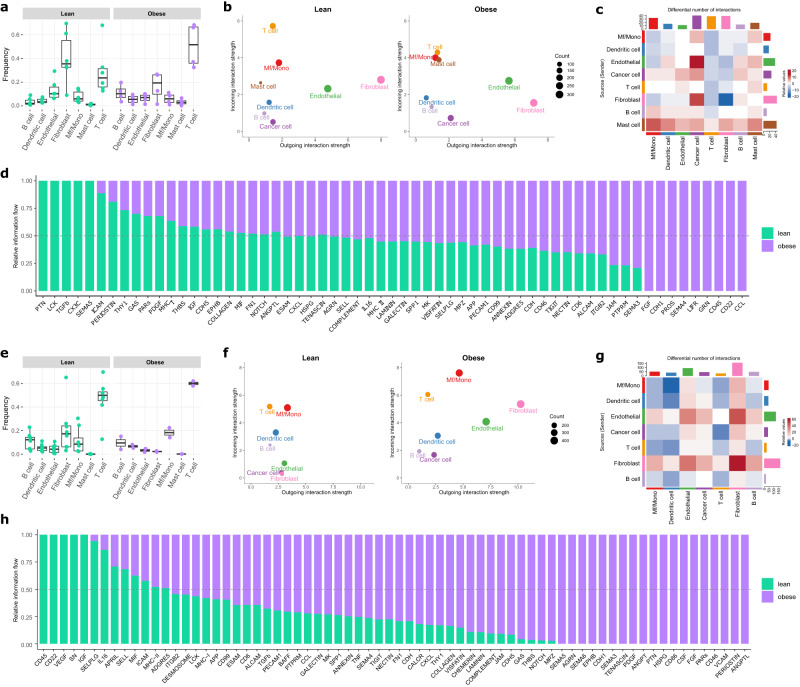
Fig. 6. Obesity-associated differences in the cell composition and intercellular interactions within the tumor microenvironment of primary breast cancer detected from the single-cell profiling of NST ER+/HER2- and NST ER-/HER2- tumors from the BioKey cohort.
a, e Frequencies of non-malignant cell types relative to the non-malignant cell pool for NST ER+/HER2- (a) and NST ER-/HER2- (e) lean and obese patients (NST ER+/HER2− lean, n = 6; obese, n = 4; NST ER−/HER2− lean, n = 8; obese, n = 2). Each data point represents the frequency of the corresponding cell type detected in an individual sample. In each boxplot, the box denotes the range from the 25th to the 75th percentile, the center line indicates the median value, and the whiskers specify the maxima and minima excluding outliers. b, f CellChat-derived outgoing and incoming interaction strength from and to cancer cells and non-malignant cells in NST ER+/HER2- (b) and NST ER-/HER2- (f) tumors from lean and obese patients. c, g Differential number of interactions in NST ER+/HER2- (c) and NST ER-/HER2- (g) tumors detected by CellChat between lean and obese. d, h Relative Information flow of signaling pathways in the intercellular communication network in NST ER+/HER2- (d) and NST ER-/HER2- (h) tumors from lean and obese patients. The relative information flow was estimated by the sum of CellChat-derived communication probability between all pairs of cell compartments in the network. Signaling pathways with non-zero information in at least one of the BMI categories are shown.

