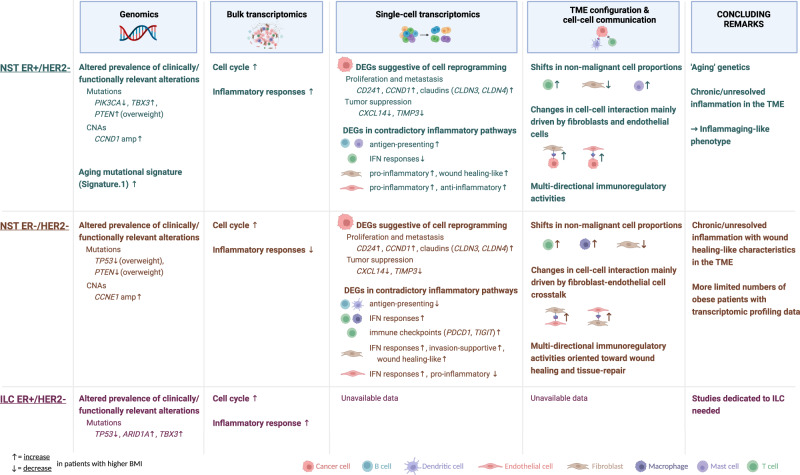
Fig. 7. Overview of the main findings from the analyses of different datasets for the three subgroups NST ER+/HER2−, NST ER−/HER2−, and ILC ER+/HER2−.
Observations involving features of known or potential clinical relevance and those hypothesized to imply biological heterogeneity are highlighted. Up and down arrows accompanying highlighted features denote, respectively, increase and decrease in either prevalence, expression level, or frequency in obese, or overweight if specified, compared to lean patients. Created with BioRender.com.

