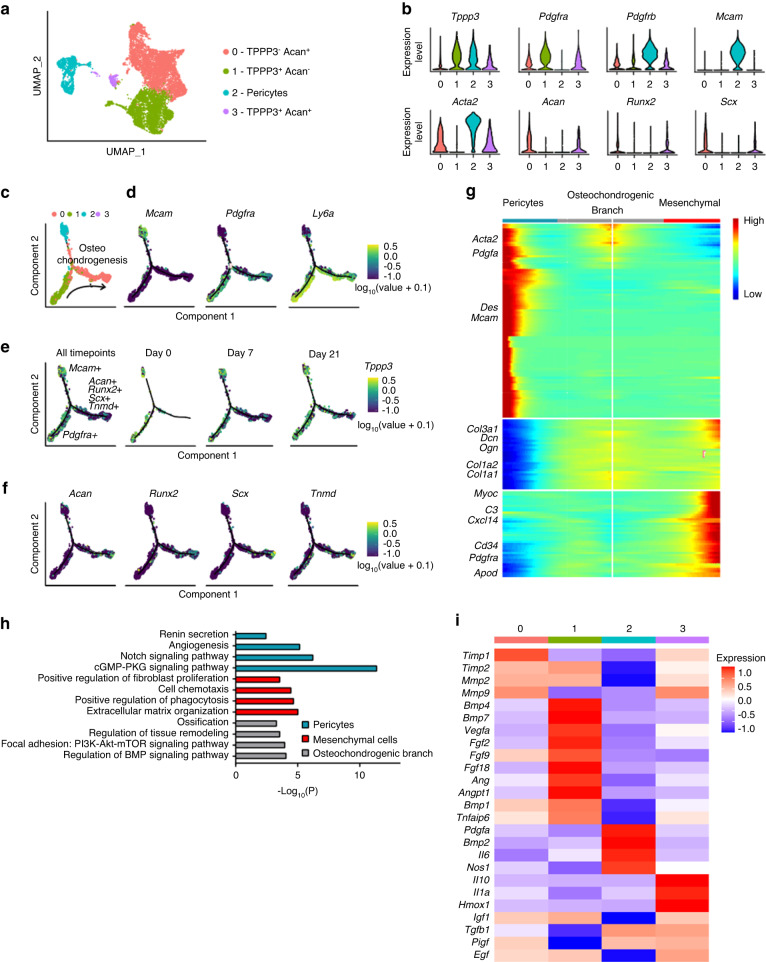
Fig. 2.
Cell subclustering and pseudotemporal trajectory analysis reveal a hierarchy of osteochondrogenic progenitors in relation to Tppp3 expression. a UMAP visualization of mesenchymal and pericyte subclusters. Three subclusters were found among mesenchymal cells: Cluster 0 (Tppp3- Acan+), Cluster 1 (Tppp3+ Acan-) and Cluster 3 (Tppp3+ Acan+). b Expression of mesenchymal (Pdgfra), pericyte (Pdgfrb, Mcam, Acta2) and tenocyte-like cells (Scx) and osteochondrogenic markers (Runx2, Acan) in each cell subcluster. c Pseudotime trajectory analysis of the four subclusters. d Expression of pericyte and mesenchymal markers across pseudotime. e Expression of Tppp3 across pseudotimes at all timepoints or individually at each time point. f Expression of tenocyte (Scx, Tnmd), chondrocyte (Acan) and osteoblast-related genes (Runx2) across pseudotime. g Heatmap of the pseudotime trajectory of pericytes (left), mesenchymal cells (right), and their common osteochondrogenic branch (center). h GO term analysis of clusters identified with pseudotime analysis, including pericytes, mesenchymal cells, and osteochondrogenic cells. i Heatmap showing the expression of secreted factors that regulate heterotopic ossification in the four cell subclusters. n = 4 biological replicates per time point. Animals and 1 460 (0 d), 6 317 (7 d) and 3 484 (21 d) mesenchymal cells per timepoint for scRNA-seq

