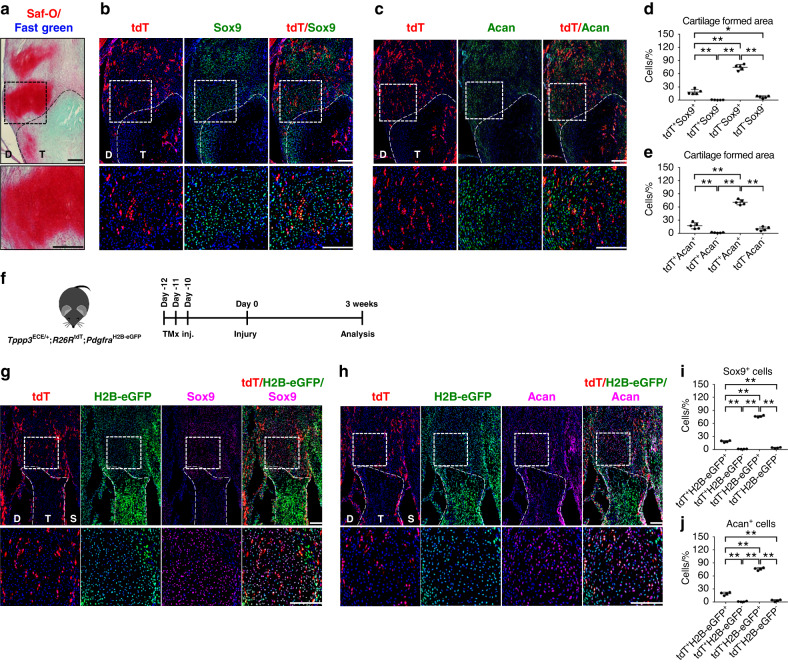
Fig. 3.
Tppp3+ cells give rise to cartilage after HO induction in the Achilles tendon. a Cartilage area was visualized using Saf-O/Fast Green staining. Cartilage-like matrix appears red. The dashed black line indicates the margins of the tendon. The dashed black box in the upper panels is magnified in the lower panels (scale bars in panels: 200 µm). D, deep; T, tendon. b, c tdT+ cells and Sox9 or Acan immunohistochemical staining within representative sagittal sections of the distal tenotomy site. The dashed white line indicates the margins of the remaining tendon tissue. The dashed white box in the upper panels is magnified in the lower panels (scale bars in panels: 200 µm). D: deep; T: tendon. d, e Quantification of tdT+ and Sox9+ or Acan+ cells within the cartilage-formed area (n = 5 animals per group). f Schematic of the experiment: Tppp3ECE/+;R26RtdT;PdgfraH2B-eGFP animals were administered TMx for three continuous days, and reporter activity was examined at 3 weeks after injury. g, h tdT+ and H2B-eGFP (Pgdfra) + cells and Sox9 or Acan immunohistochemical staining within representative sagittal sections of the distal tenotomy site. The dashed white line indicates the margins of the remaining tendon tissue. The dashed white box in the upper panels is magnified in the lower panels (scale bars in panels: 200 µm). D, deep side; T, tendon area; S, superficial side. i, j Quantification of tdT+ and H2B-eGFP+ Sox9− or Acan− expressing cells within the cartilage-formed area (n = 4 animals per group). For all graphs, each dot represents a single animal, with the mean ± 1 SD indicated. Statistical analysis was performed using one-way ANOVA with Tukey’s post hoc test. *P < 0.05 and **P < 0.01

