Fig. 7.
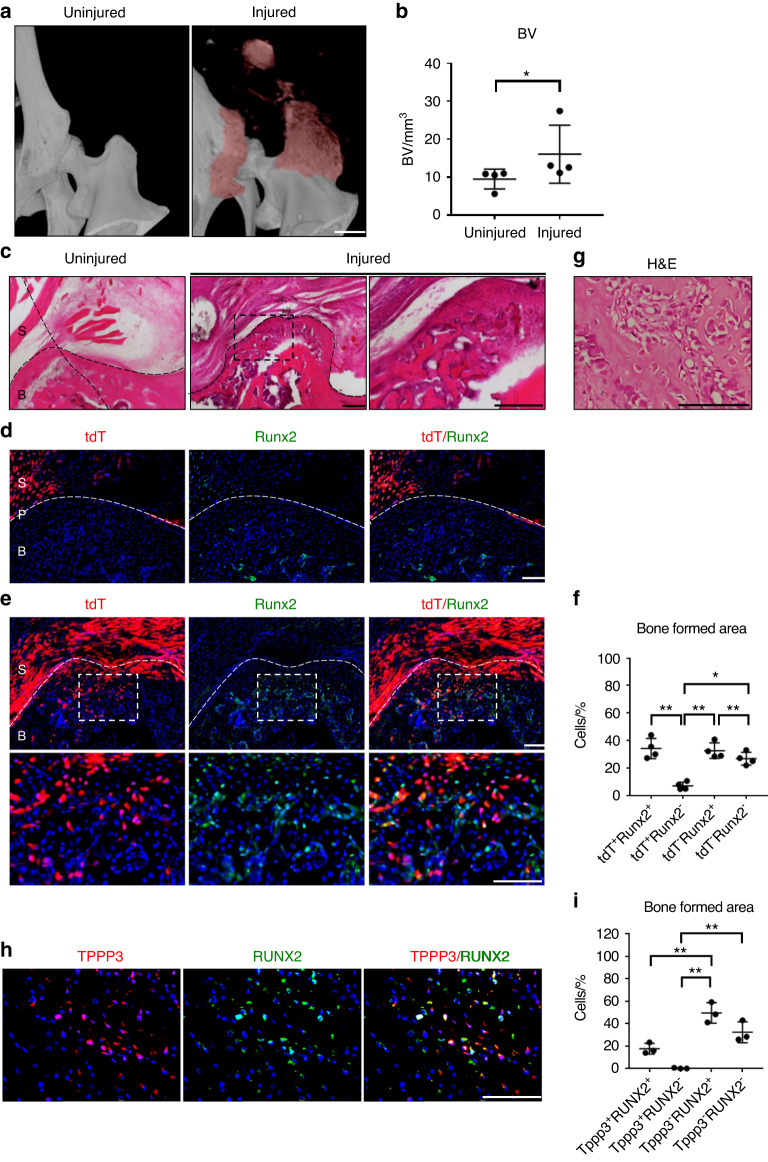
Tppp3+ cell contribution to periosteal sites after HO induction in a hip postarthroplasty HO model. a µCT reconstruction of bone formation at 3 weeks after injury. Heterotopic bone appears red, while native bone appears white. b µCT quantification of heterotopic BV (scale bar: 1 mm, n = 4 animals per group). c The bone formed area was visualized using H&E staining at the periosteal site of the femoral bone. The dashed black line indicates the margins of heterotopic bone. The dashed black box in the upper panels is magnified in the lower panels (scale bars in panels: 200 µm). d, e tdT+ and Runx2 immunohistochemical staining at periosteal sites of femoral bone (scale bars in panels: 100 µm). The image in (d) represents the contralateral control side, and the image in (e) represents the injured side. Dashed white lines indicate margins of bone. The dashed white box in the upper panels is magnified in the lower panels. S: synovium; B: bone; P: periosteum. f Quantification of tdT+ and Runx2+ cells within the bone area (n = 4 animals per group). g H&E staining showed human heterotopic ossification of a human sample (scale bar in panel: 200 µm). h TPPP3 and RUNX2 immunofluorescence staining within human heterotopic ossification in a hip joint (scale bar in panel: 200 µm). i Quantification of TPPP3+ and RUNX2+ cells within the bone area (n = 3 slides per group). For all graphs, each dot represents a single sample, with the mean±1 SD indicated. Statistical analysis for (b) was performed using the Mann-Whitney test. Statistical analysis for (f, i) was performed using one-way ANOVA with post hoc Tukey’s test. *P < 0.05 and **P < 0.01

