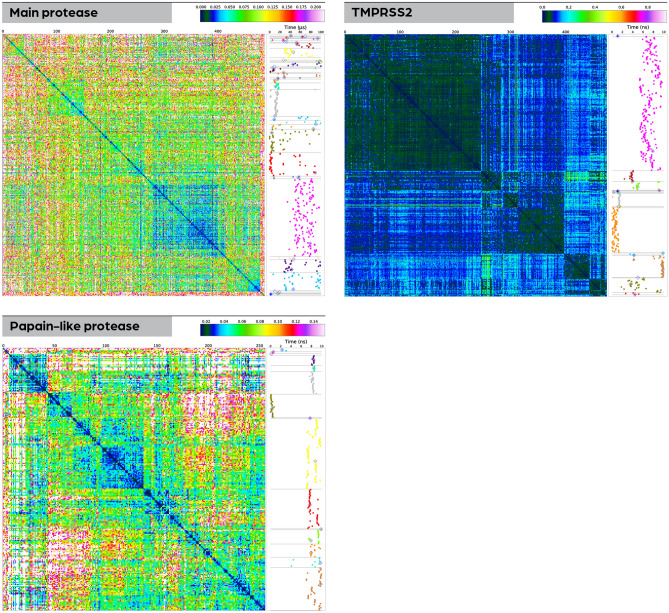
Figure 8.
Heatmaps based on clustering of snapshot cavities for the investigated enzymes. Using the clustering, cavity representatives for different dynamic states of the cavity were detected. The heatmap for each molecule (plotted on the left side) shows matching scores of 3D point clouds with the color legend shown above each subfigure. The narrow vertical panel on the right of each heat map contains a time-resolved visualization of cluster assignments for each snapshot’s active-site point cloud. The coloring in this panel is not related to the color scheme in the heatmap but simply indicates the different clusters. The horizontal light gray lines indicate cluster boundaries and correspond to the boundaries’ location in the heatmap. While only representatives of clusters containing more than 5% of all cavities were used further in the workflow, the representatives of all clusters are marked in this figure by a light gray diamond.

