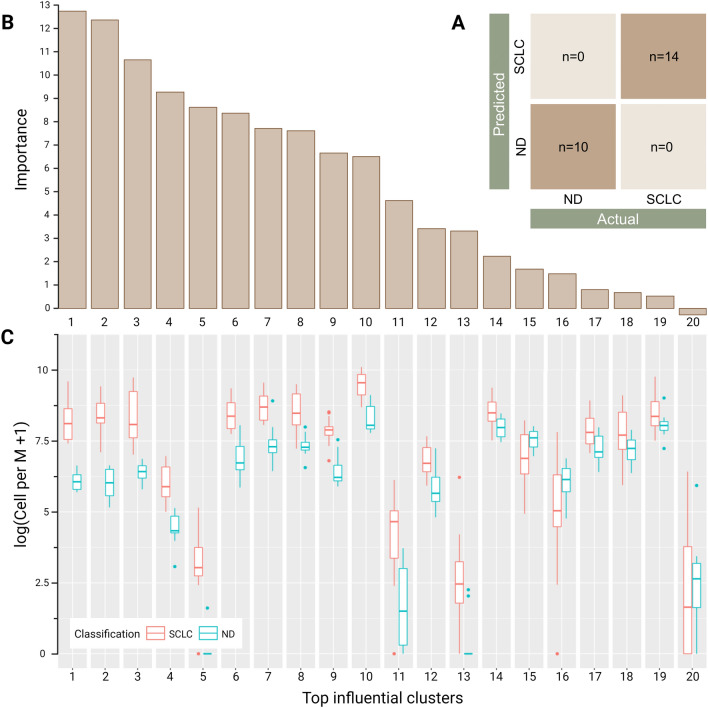
Figure 2.
Patient-level classification model results using HDSCA3.0 liquid biopsy data. (A) Confusion matrix of predicting NDs and SCLC patients. (B) Feature importance ranking of the top influential clusters. Depicts the relative contribution of each event cluster to making correction predictions. (C) Box plots showing the distribution of the top 20 influential clusters separated by each classification. The plot is shown on a logarithmic scale depicting cells per million (Cell per M).

