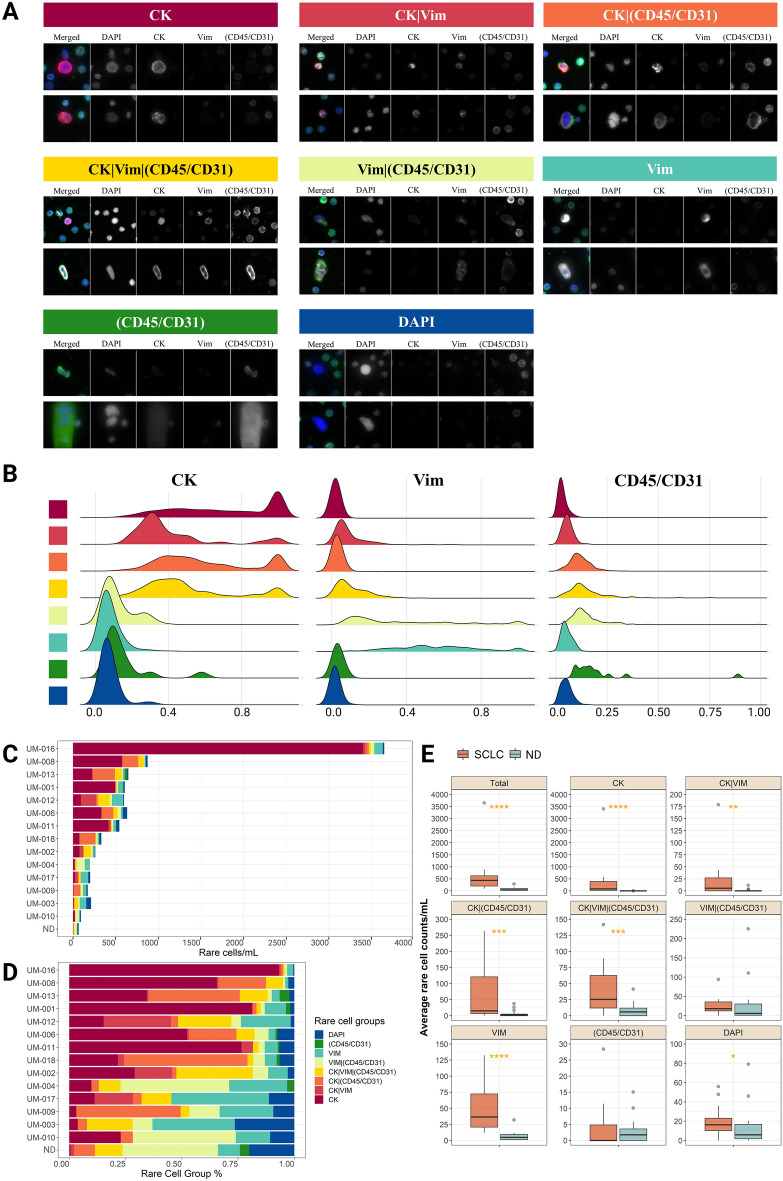
Figure 3.
Circulating rare cells identified in the peripheral blood from SCLC patient samples using HDSCA3.0 with the Landscape assay. (A) Representative cell images of each cell group. Each row shows a composite image plus each of the four channels separately; DAPI in blue, CK in red, Vim in white, (CD45/CD31) in green. (B) Signal distribution of immunofluorescent markers for channel-based cells. Each cell group is correspondingly annotated to (A) with eight different colors. (C) The number of total rare cells per ml is calculated for each SCLC patient and ND. Each rare cell group is annotated with eight different colors which are shown in the bottom middle of the figure. The number of rare cells of 50 NDs was averaged. (D) Proportion plot of the rare cell groups of each SCLC patient and averaged NDs. (E) Box plots comparing cell counts per ml of each cell group between NDs and SCLC patient samples. *: p-value ≤ 0.05, **: p-value ≤ 0.01,***: p-value ≤ 0.001,****: p-value ≤ 0.0001.

