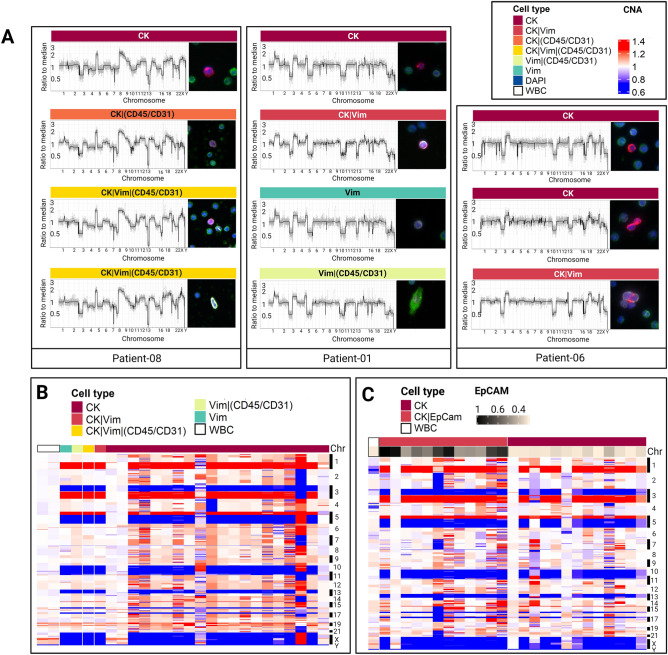
Figure 5.
Single-cell CNA profiling of rare cells detected in SCLC peripheral blood samples. (A) CNA profile of representative single rare cells from each SCLC patient and their Landscape-stained cell images; CK in red, Vim in white, CD45/CD31 in green, and DAPI in blue. The rare cell type of each cell is annotated with color labels at the top right. (B) CNA profiles of sequenced cells from UM-001 stained by Landscape assay. (C) CNA profiles of sequenced cells from UM-001 stained by EpCAM-targeted assay. EpCAM expression for each cell is shown at the bottom of the heatmap. The rare cell group of each cell in B and C are annotated with different color labels at the top left of each heatmap. CNA gains are shown in red, neutrals in white, and losses in blue.

