
Figure 2.
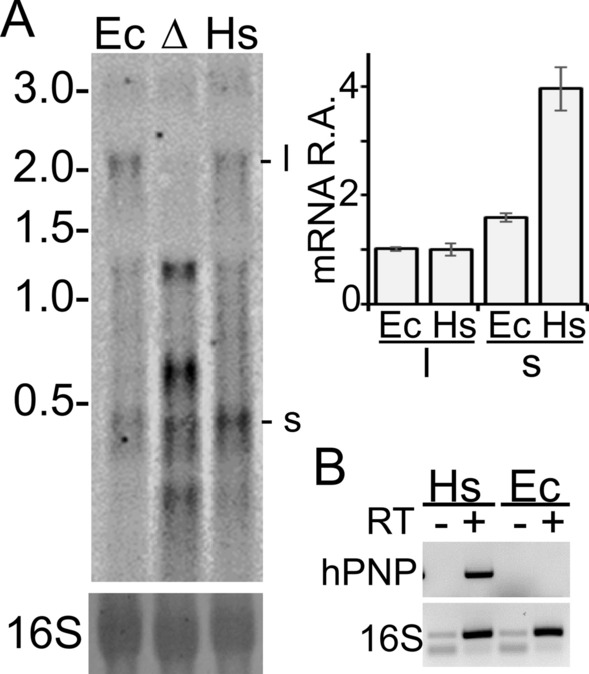
PNPT1Ec gene transcription pattern. (A) Northern blotting. RNA was extracted from exponential cultures of C-1a (pnp+; Ec), C-5691 (Δpnp; Δ) and C-6001 (PNPT1Ec; Hs). 20 µg of RNA were run on 1.5% denaturing agarose gel, blotted onto a nylon filter and hybridized with the RNA pnp-5′ radiolabelled riboprobe as detailed in Methods. Upper left panel, MW marker length and position in the gel are reported on the left in kb, whereas the main signals corresponding to 2.2 kb (l) and < 0.5 kb (s) transcripts are indicated on the right; lower left panel, 16S rRNA stained with methylene blue before hybridization as loading control; right panel, mRNA Relative Amount (R.A.). l and s signals were quantified with ImageQuant and values normalized by l value in E. coli. Bars represent average (N = 3) with standard deviation (StD). (B) RT-PCR analysis. 1 µg of RNA extracted from exponential cultures of C-1a (Ec) and C-6001 (Hs) grown as described above was incubated with random hexamers and with (+) or without (−) reverse transcriptase. The cDNA and control samples were PCR-amplified with primers specific for either the PNPT1Ec mRNA (hPNP) or 16S rRNA (16S) and run on a 2% agarose gel.