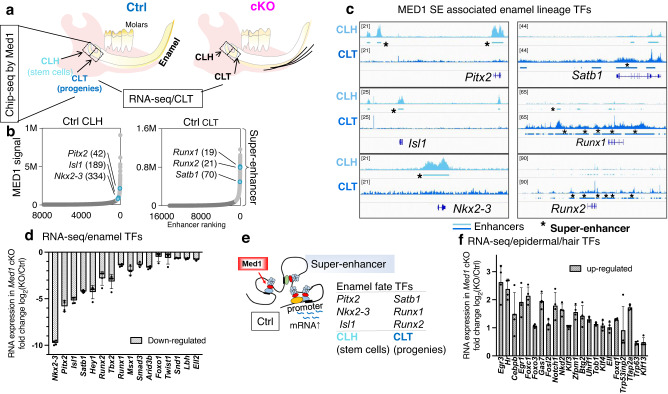
Fig. 5. Med1 directly controls enamel lineage transcription factors by associating with their enhancers and promoters.
a Schematic representation of tissues isolated (CLH; stem cells, CLT; stem cell progenies) from normal mouse mandibles for MED1 ChIP-seq and RNA-seq. b MED1 bound enhancer clustering in CLH and CLT tissues. Light gray and blue dots represent super-enhancers, dark gray dots are typical enhancers; blue dots outline super-enhancer associated with enamel transcription factors as designated by gene name and enhancer ranking numbers. c Genomic MED1 binding profiles in CLH (light blue) and CLT (blue) tissues on mouse genome (mm10) for relevant transcription factors. Super-enhancers (SE) are marked by bars with asterisks*. Average profiles from two independent ChIP-seq experiments are shown, in which cervical loop tissues from 2–4 mice (Med1 cKO and littermate control) are pooled for one ChIP experiment (total 4–8 cervical loop tissues). d Transcription factors (TFs) identified through MED1 super-enhancer that were down-regulated in Med1 cKO (CLT) as measured by RNA-seq. e Schematic of Med1 inducing enamel fate transcription factors (TFs); distal MED1 (red) containing super-enhancers associate to gene promoters to induce mRNA expression (blue waved lines). f Enhancer-associated epidermal or hair fate transcription factors (TFs) that were upregulated in cKO (CLT) as measured by RNA-seq. d, f Data are shown as fold changes (log2 FC) with standard deviations (n = 4, error bars) with statistical significance (t-test, p < 0.05) in combinatory analysis of cKO compared to Ctrl within two different litters of Med1 cKO and control mice (6 CL tissues each group). The diagram of the mandibles (pink colored) is derived from our previous publication39 but modified here, and same for ones in Fig. 6a and Supplementary Figs. 2b, 8d, and 9a, and CL tissues in Fig. 7a.

