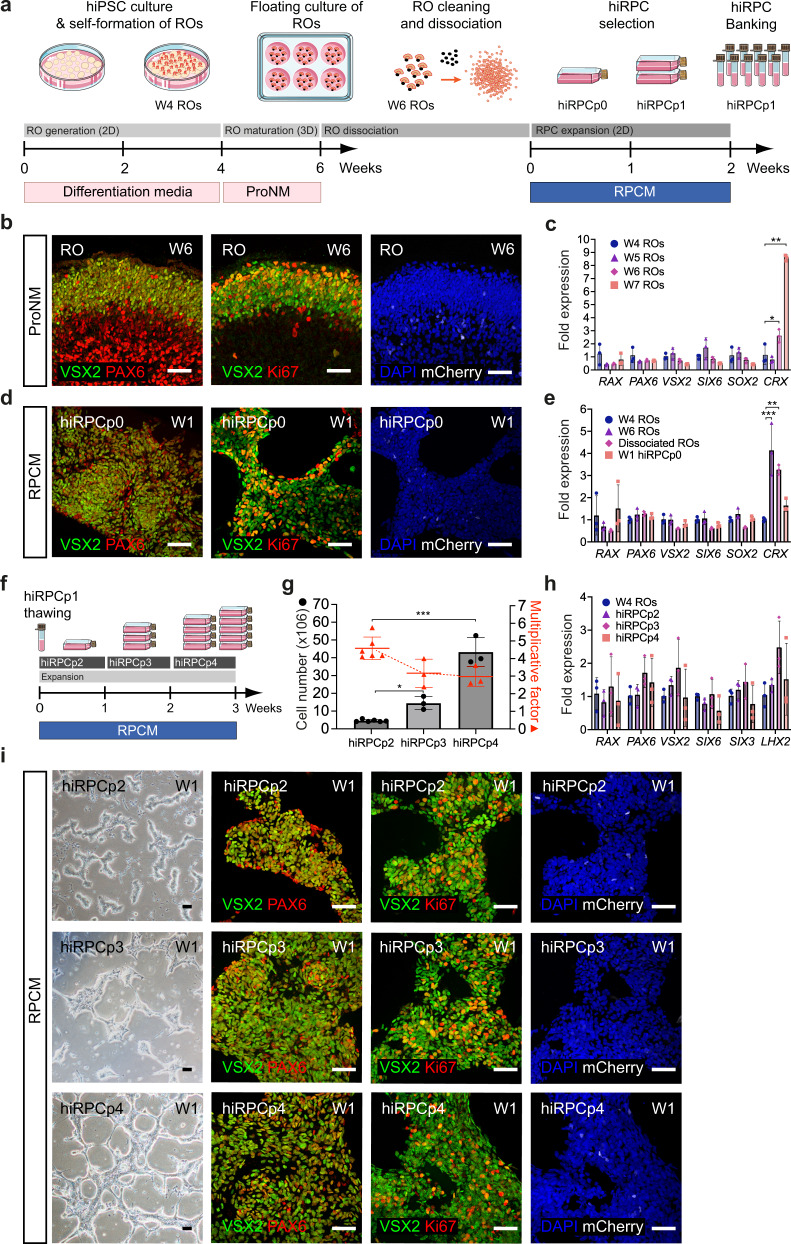
Fig. 1. Generation and characterization of a retinal progenitor cell line from iPSC-derived retinal organoids.
a Schematic diagram illustrating the protocol for the generation of RPCs from hiPSCs and cell banking. b Immunofluorescence staining of cryosectioned ROs at W6 for VSX2, PAX6, Ki67, and endogenous mCherry staining. c RT-qPCR analysis of eye-field transcription factors (EFTFs; RAX, PAX6, VSX2, SIX6), SOX2, and CRX in ROs between W4 and W7. Data are normalized to that of W4 ROs and presented as mean ± SD (n = 3 per time point). d Immunofluorescence staining of hiRPCp0 after one week of culture (W1) in RPCM for VSX2, PAX6, and Ki67 and endogenous mCherry staining. e RT-qPCR analysis of EFTFs (RAX, PAX6, SOX2, SIX6), VSX2, and CRX in ROs at W4 and W6, dissociated ROs at day 1, and hiRPCp0 expanded for one week (W1) in RPCM. Data are normalized to that of W4 ROs and presented as mean ± SD (n = 3 per time point). f Schematic diagram illustrating hiRPC expansion in RPCM from cryopreserved hRPCp1 to hiRPCp4 in three weeks. g Multiplication factor (red) and hiRPC number (gray histograms) after successive passages. Data are normalized to that of seeded hiRPCp2 at D0 and presented as mean ± SD (n = 6 for hiRPCp2 and n = 3 for hiRPCp3-4). h RT-qPCR analysis of EFTFs (RAX, PAX6, SIX6, SIX3, LHX2) and VSX2 in W4 ROs and hiRPCp2 to hiRPCp4. Data are normalized to that of W4 ROs and presented as mean ± SD (n = 3 per time point). i hiRPC characterization after one week (W1) of culture in RPCM by phase-contrast and brightfield microscopy (left panels) and immunofluorescence staining of hiRPCp2, hiRPCp3, and hiRPCp4 for VSX2, PAX6, and Ki67 and endogenous expression of mCherry. One-way ANOVA followed by a Dunnett’s multiple comparison test (c, e, g, h). Comparison to W4 ROs (c, e, h) or hiRPCp2 (g). ***p < 0.001; **p < 0.01; *p < 0.05. Nuclei were counterstained with DAPI (blue). hiPSC-5FC-derived cells. Scale bar: b, d, i, 50 µm.

