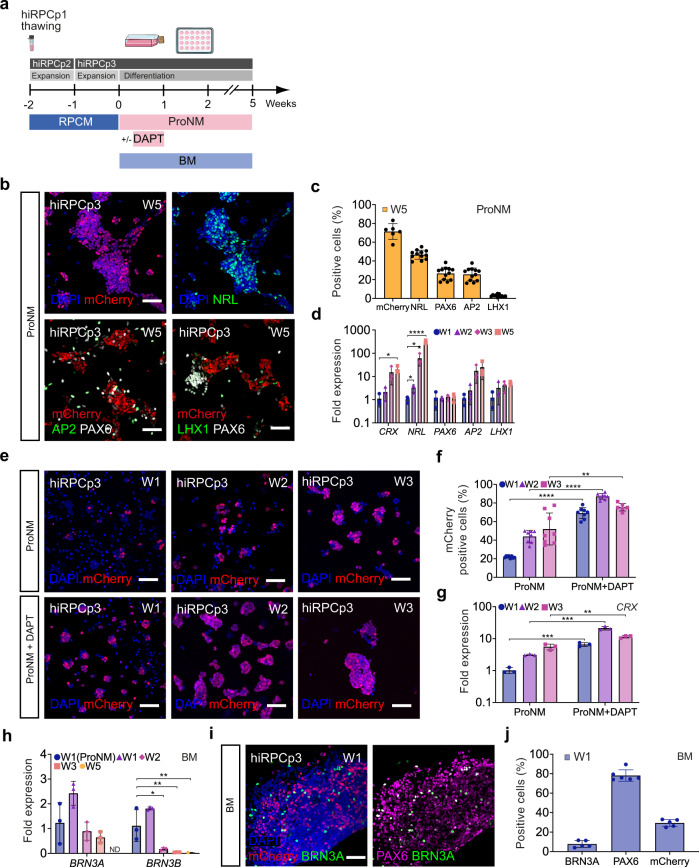
Fig. 3. Differentiation of hiRPCs into neuroretinal cells.
a Schematic diagram illustrating the differentiation protocol to generate early retinal cell types. b Immunofluorescence staining and endogenous expression of differentiated hiRPCp3 after five weeks (W5) of culture in ProNM for mCherry (hiPPCs), NRL (rod photoreceptor precursors), AP2 (amacrine cells), LHX1 (horizontal cells), and PAX6 (amacrine and horizontal cells). c High-content analysis of mCherry, NRL, AP2, and LHX1+ cells (%) in adherent cultures of hiRPCp3 differentiated in ProNM at W5. Data are presented as mean ± SD (n = 6 for mCherry and n = 12 for NRL, AP2 and LHX1). d RT-qPCR analysis of neuroretinal markers (CRX, NRL, AP2, and LHX1) in hiRPCp3 differentiated in ProNM from W1 to W3 and at W5. Data are normalized to that of hiRPCp3 at W1 and presented as mean ± SD (n = 3 per time point). e Endogenous expression of mCherry of hiRPCp3 differentiated in ProNM ± DAPT from W1 to W3. f High-content analysis of mCherry+ cells (%) in adherent cultures of hiRPCp3 differentiated in ProNM ± DAPT from W1 to W3. Data are presented as mean ± SD (n = 8 per time point). g RT-qPCR analysis of the PPC marker CRX in hiRPCp3 differentiated in ProNM ± DAPT from W1 to W3. Data were normalized to that of hiRPCp3 differentiated in ProNM at W1 and presented as mean ± SD (n = 3 per time point). h RT-qPCR analysis of the retinal ganglion cell (RGC) markers BRN3A and BRN3B in hiRPCp3 differentiated in ProNM or BM from W1 to W3 and W5. Data were normalized to that of hiRPCp3 differentiated in ProNM at W1 and presented as mean ± SD (n = 3 per time point). i Immunofluorescence staining of hiRPCp3 differentiated in BM at W1 for mCherry (hiPPCs), BRN3A (RGCs), and PAX6. j High-content analysis of mCherry (hiPPCs), BRN3A (RGCs), and PAX6+ cells (%) in adherent cultures of hiRPCp3 differentiated in BM at W1. Data are presented as mean ± SD (n = 5 for mCherry and BRN3A and n = 6 for PAX6). One-way ANOVA followed by a Dunnett’s multiple comparison test (d, h). Comparison to W1 (d) or W1 ProNM (h). Two-tailed Student’s t-test for two-group comparisons (g). ****p < 0,0001; ***p < 0.001; **p < 0.01; *p < 0.05. Nuclei were counterstained with DAPI (blue). hiPSC-5FC-derived cells. Scale bar: b, e, i, 50 µm.

