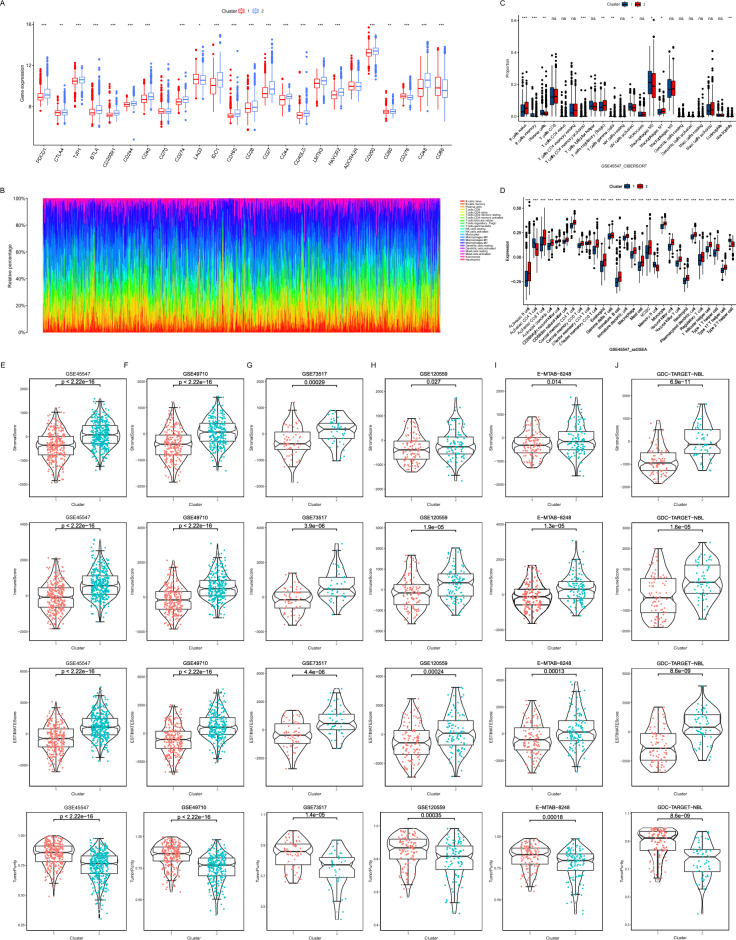
Figure 3.
Comparison of immunization of two clustered subtypes. (A) Box plots showed the mRNA expression of immune checkpoints in two clusters (*P < 0.05; **P < 0.01; ***P < 0.001). (B) Stacked bar chart showed the percentage of immune cells in 1811 patients. (C) Box plots were used to display the distribution of the cell proportions calculated by the CIBERSORT algorithm of immune cells between the two clusters (*P < 0.05; **P < 0.01; ***P < 0.001). (D) Box plot of the distribution of immune cell expression between the two clusters as calculated by the ssGSEA algorithm (*P < 0.05; **P < 0.01; ***P < 0.001). (E–J) Box plots were created to visualize the distribution of the Stromal Score, Immune Score, ESTIMATES Score, and Tumor Purity, which were calculated by the ESTIMATE algorithm between the two clusters in the GSE45547 (E), GSE49710 (F), GSE73517 (G), GSE120559 (H), E-MTAB-828 (I) and TARGET (J) datasets.

