Figure 8.
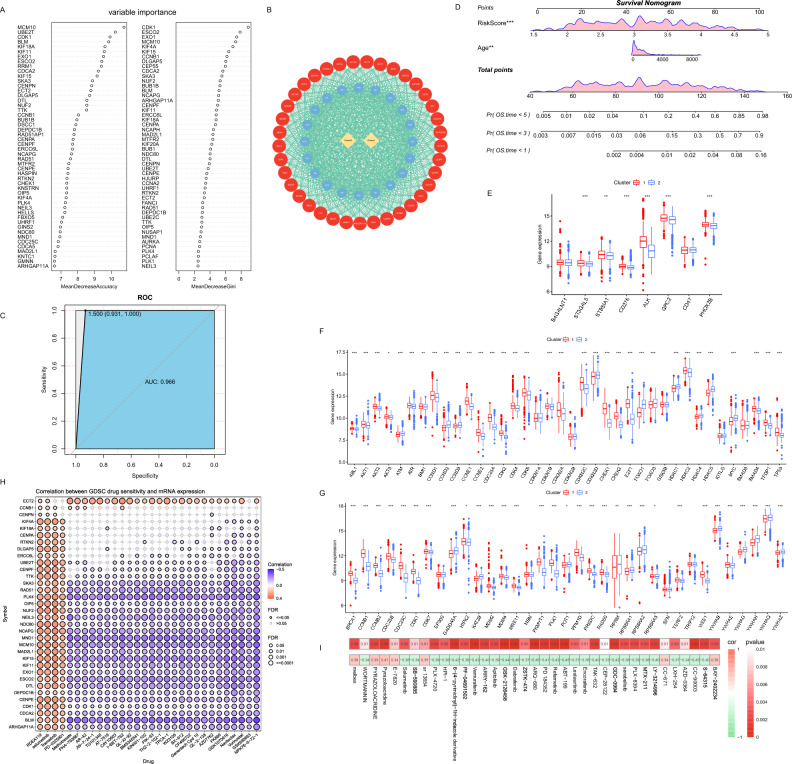
Neural Networks and Treatment Analysis. (A) Importance ranking chart of variables based on MDA and MDG. (B) Neural network structure schematic. The outer red layer represents the input layer, the middle blue represents the 20 hidden neurons, and the output layer is yellow. (C) ROC curves demonstrate the classification performance of the neural network in the GSE49710 dataset. (D) Assessment of patient survival probability using nomograms. (E) Immunotherapy target gene expression levels. (F) G1/S cell cycle checkpoint gene expression levels. (G) G2/M cell cycle checkpoint gene expression levels. (H) GDSC database drug sensitivity analysis results. (I) Heat map of correlation between risk score and drug sensitivity.

