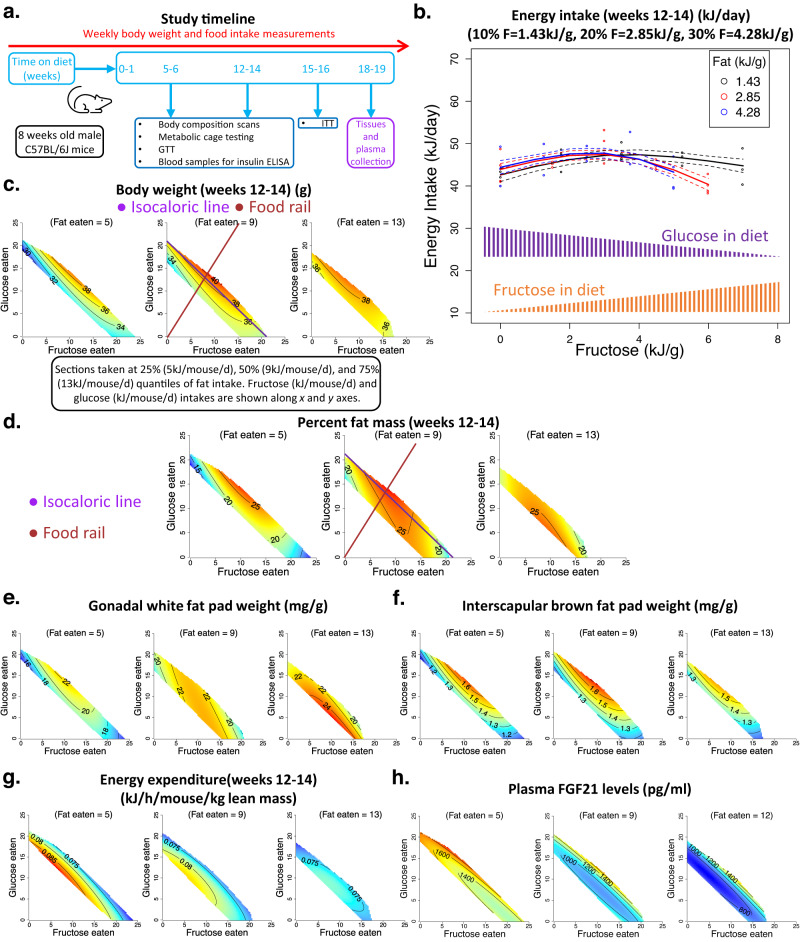
Fig. 1. The effects of fat, fructose and glucose intake on body composition of mice.
(See Supplementary Data 2 for statistics). Source data are provided as a Source Data file. a Overall study timeline. Mice were fed on experimental diets for 18–19 weeks. After 5–6 and 12–14 weeks, metabolic parameters were measured. GTT glucose tolerance test, ITT insulin tolerance test. b Plot showing the effect of dietary fructose (kJ per g food) on energy intake (kJ per mouse per day) at lower (10% energy), medium (20%) and higher (30%) fat (F) content at 12–14 weeks. Along the x-axis, as fructose levels increase, glucose content in the diet decreases. For diets with a 50:50 fructose:glucose ratio, each monosaccharide was supplied at 3.5, 3.0 and 2.5 kJ per g of diet for the 10%, 20% and 30% fat diets, respectively. Each symbol (ο) represents the average energy intake per mouse per cage (n = 4 mice per cage). The fitted lines were derived from generalised additive modelling (GAM), fitting an interaction between a smooth term for fructose content (in one dimension) and fat content as a three-level categorical factor, and the dotted lines represent s.e.m. for fitted values. c–h Response surfaces showing the relationship between the intake of fructose-, glucose- and fat-derived energy (kJ per mouse per day) and body weight (g) (c), and per cent fat mass of mice at weeks 12–14 (d), gonadal fat pad weight (mg/g body weight) (e), interscapular brown fat pad weight (mg/g of body weight) (f), average energy expenditure over 24 h at weeks 12–14 (kJ per hour per mouse per kg lean mass) (g) and plasma FGF21 (pg/ml) concentration at weeks 18–19 (h). Three two-dimensional (2D) slices were taken at 25%, 50% (median) and 75% quantiles of fat intake and show all three nutrient dimensions (fructose, glucose, and fat). See Supplementary Information for the details of how to interpret these NG surfaces.

