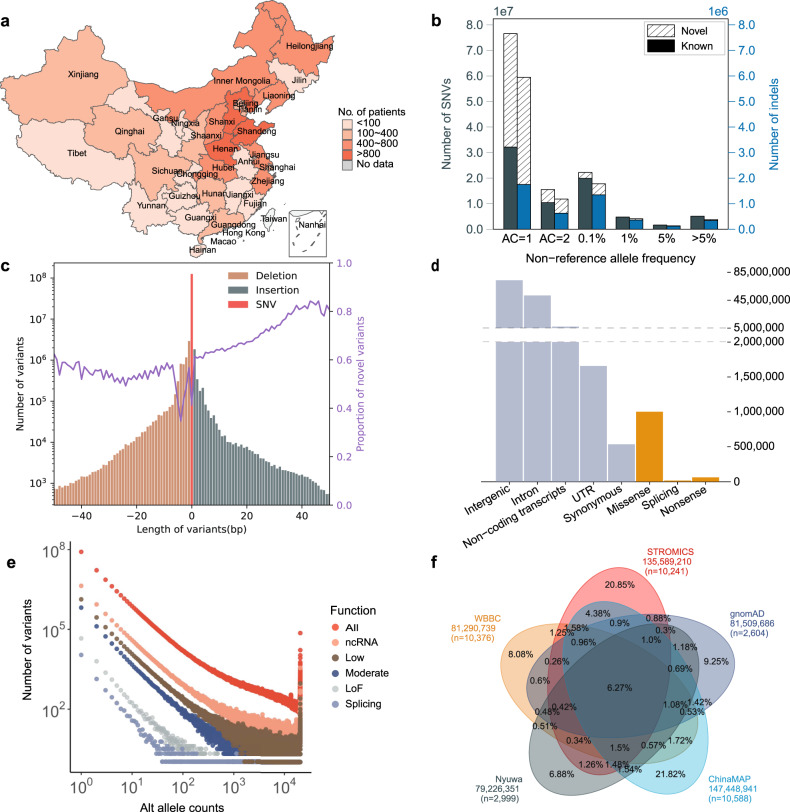
Fig. 2. Allele frequency spectrum and functional annotation of the 135.59 million genetic variants among 10,241 individuals from STROMICS.
a The geographical distribution of STROMICS samples in China. b The number and allele frequency spectrum of STROMICS variants (SNVs and indels). Novel and known variants are defined by dbSNP (Materials and methods). AC, allele count. c Length and number distribution of STROMICS variants. The purple line shows the proportion of novel variants. d The total number of variants observed in each functional class of genome. e Relationship between alternative allele count and the number of variants among different functional categories. The function categorization of the genetic variants (All, LoF, splicing, Moderate, Low, ncRNA) was shown in Supplementary Table S8. f Venn diagram showing the concordance of genetic variants among STROMICS, gnomAD, ChinaMAP, NyuWa Genome resource, and WBBC.

