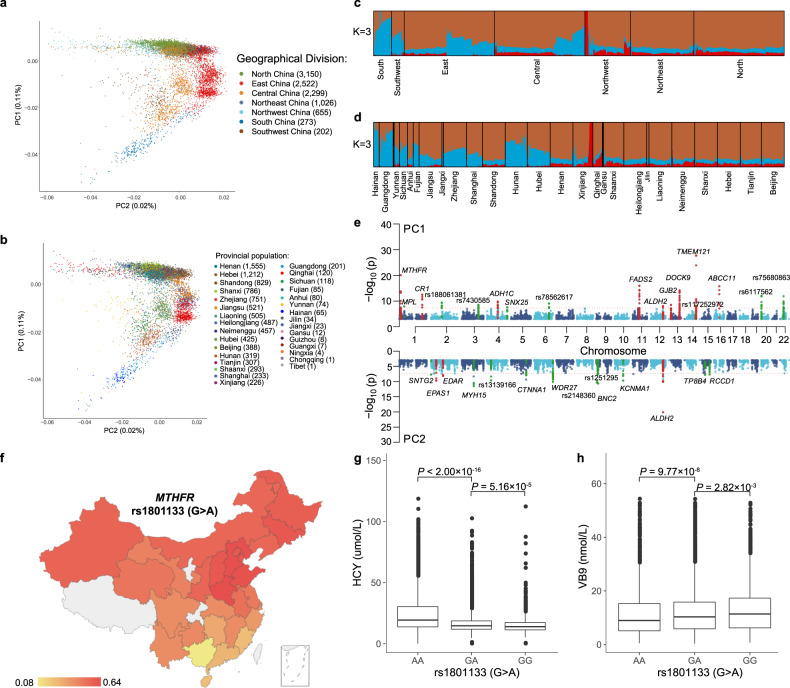
Fig. 3. Population structure and adaptation.
a, b PCA of all the individuals in STROMICS (n = 10,241) colored by seven geographical regions (a) and by 31 provincial divisions (b). Each point represents one participant and is placed according to their eigenvectors. c, d Distribution of the 3 ancestry components in STROMICS participants (n = 10,241) of geographical region (c) and of provincial divisions (d) as inferred using the ADMIXTURE for K = 3. Each color reflects one of the three ancestral components. The proportion of ancestral components for each individual was indicated by a stacked bar. Individuals were organized by provinces along the x-axis. e Genomic signatures under selection along PC1 (upper panel) and PC2 (lower panel). The nearest gene of the lead SNV for each selection signal is indicated. f A geographical distribution of the A allele frequency of the SNV rs1801133 (chr1:11796321) in the MTHFR and CLCN6 loci under genetic selection in the STROMICS population. Provinces with a sample size of < 5 were filled in gray. g, h Linear regression of homocysteine and VB9 (folate) on the three genotypes of rs1801133, respectively, with gender, age, history of stroke, and the day duration between stroke onset and the blood sampling as the covariates.

