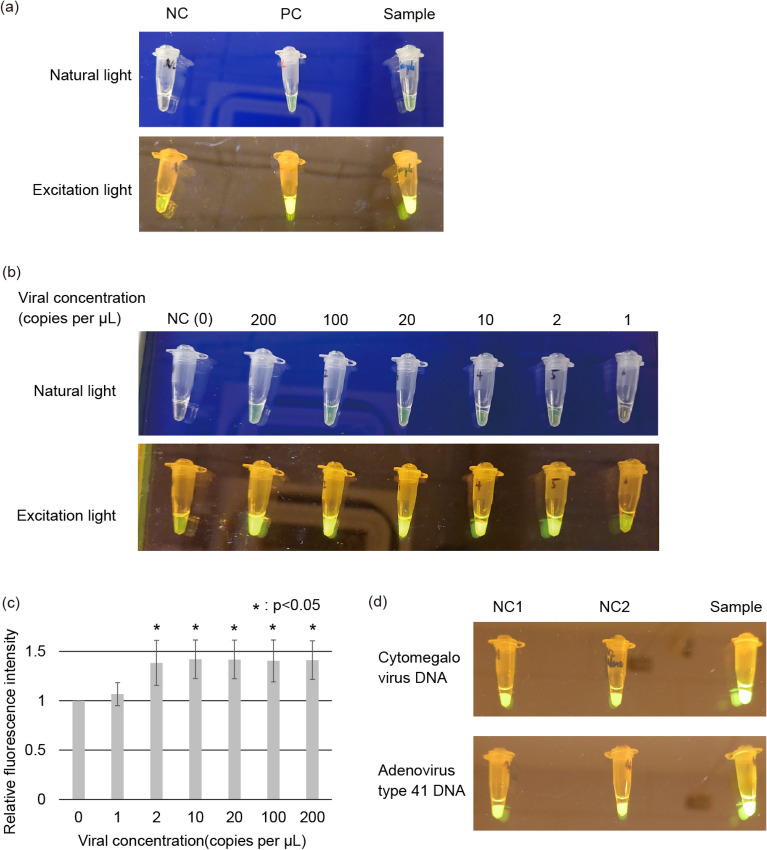
Figure 4.
NEC-SD-LAMP experiment for detecting viral DNA. These photographs show the samples in the PCR tube after the reaction and were taken under natural or excitation light irradiation. (a) Functional comparison of NEC-SD-LAMP with a conventional system. “NC”, NEC-SD-LAMP was performed using saliva samples without adenovirus DNA. “PC”, SalivaDirect and LAMP reactions were performed using saliva samples containing adenovirus DNA in a conventional thermal cycler. “Sample”, NEC-SD-LAMP was performed using saliva samples containing adenovirus DNA. (b) Verification of the limit of detection of NEC-SD-LAMP. “NC”, NEC-SD-LAMP was performed using saliva samples without adenovirus DNA. (c) Analysis of the fluorescence intensity of samples containing each corresponding adenovirus DNA concentration using ImageJ software. The experiment was performed three times, and the relative fluorescence intensity of each experiment was calculated based on the fluorescence intensity of the NC sample. The mean and standard deviation are shown in the graph. (d) Verification of the specificity of NEC-SD-LAMP. “NC1”, NEC-SD-LAMP was performed using saliva samples without cytomegalovirus DNA or adenovirus type 41 DNA. “NC2”, NEC-SD-LAMP was performed using saliva samples containing cytomegalovirus DNA or adenovirus type 41 DNA, and adenoviral DNA-specific primers were used. “Sample”, NEC-SD-LAMP was performed using saliva samples containing cytomegalovirus DNA or adenovirus type 41 DNA, and each corresponding viral DNA detection primer was used.

