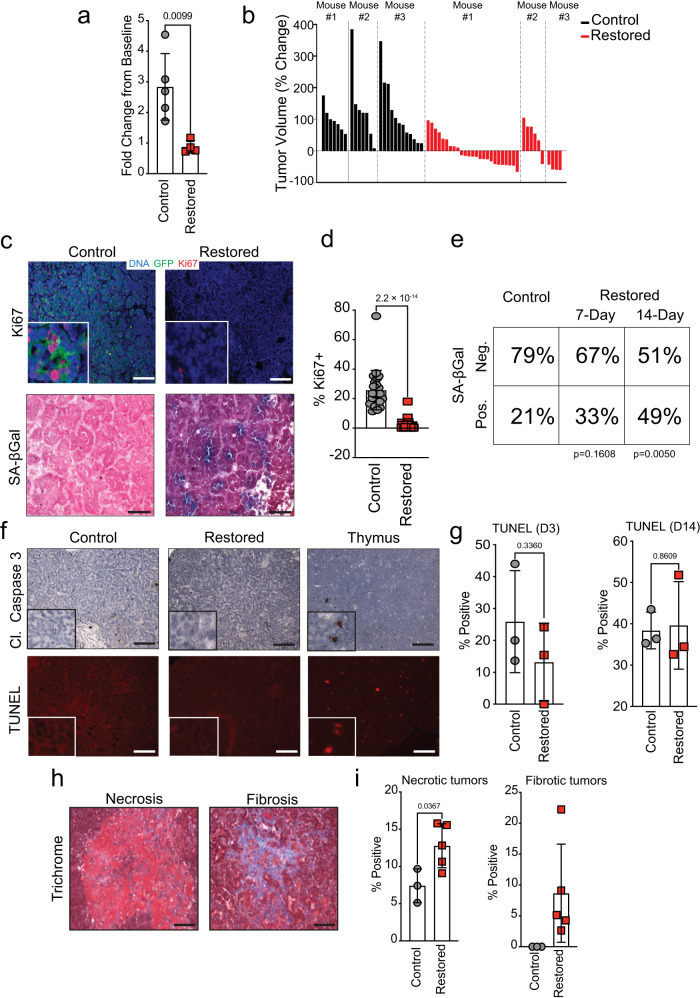
Fig. 2. p53 restoration induces either senescence or necrosis in SCLC in vivo.
a Tumor burden analysis from µCT scans. Fold change from baseline measurements. Control includes RPR2 (n = 3) and RPTRR2 (n = 2) mice. Restored RPRR2 (n = 5) mice after 11–14 days of treatment. Statistical significance determined by two-tailed Student’s t-test. Error bars represent mean ± s.d. b Waterfall plot of individual tumor volume plotted as percentage change from baseline in control (n = 3 RPTRR2) and restored (n = 3 RPRR2) mice. c Photomicrographs for GFP and Ki67 immunofluorescence and SA-β-Gal stained RPTRR2 tumors 7 days after vehicle (Control) or tamoxifen (Restored) treatment. Scale bars: 25 μm for SA-β-Gal, 50 μm for IF; insets are magnified 5×. d Quantification of Ki67 staining in control (n = 23) and restored (n = 35) tumors from (c). Statistical significance determined by two-tailed Student’s t-test. Error bars represent mean ± s.d. e Contingency analysis of SA-β-Gal staining from (c); n = 61 tumors from 7 Control mice; n = 63 tumors from 4 Restored mice at t = 7 days; n = 41 tumors from 4 Restored at t = 14 days. Statistical significance determined by two-tailed Fisher’s exact test. f Photomicrographs for cleaved Caspase-3 IHC or TUNEL stained RPTRR2 tumors. Scale bars: 25 μm for IHC, 50 μm for TUNEL; insets are magnified 5×. g Quantification of TUNEL staining from (f) 3 or 14 days after tamoxifen treatment; n = 3 mice for all treatment groups. Statistical significance was determined by two-tailed Student’s t-test. Error bars represent mean ± s.d. h Representative photomicrographs for necrosis or fibrosis positive RPTRR2 tumors from trichrome stained tissue sections. Scale bars, 25 μm. i Quantification of trichrome staining from (h) after 14 days of tamoxifen treatment. n = 3 mice for control mice; n = 5 mice for restored mice. Statistical significance determined by two-tailed Student’s t-test. Error bars represent mean ± s.d. Source data are provided as a Source Data file.

