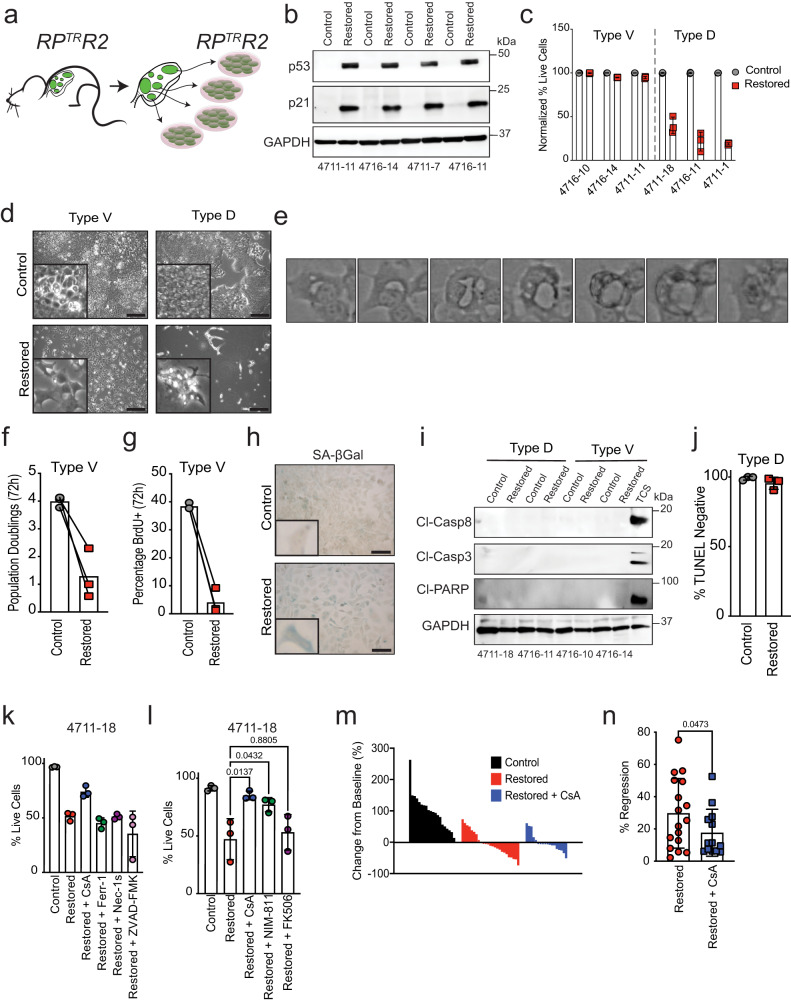
Fig. 3. p53 reactivation induces cellular senescence or cyclophilin-dependent death.
a RPTRR2 mice were infected with 1.0 × 10⁸ p.f.u of Ad:CMV-Cre to initiate tumor formation. Between 25–28 weeks after tumor initiation, tumors were excised for cancer cell line establishment. b Immunoblot analysis of RPTRR2 cell lines (n = 4) for p53 and p21 expression 24hrs after 4-OHT treatment. GAPDH is a loading control. c Flow cytometry-assisted cell viability assay in representative Type V (4711-11, 4716-10, 4716-14) and Type D (4711-1, 4711-18, 4716-11) cells 5 days after 4-OHT treatment. Live cell percentage determined by quantification of DAPI negative population; n = 3 technical replicates for all cell lines and treatment groups. Error bars represent mean ± s.d. d Brightfield photomicrographs from Type V and Type D cell lines after 5 days of 4-OHT treatment. Scale bars, 250 μm. e Time lapse video of a Type D cell dying after p53 reactivation. Video accounts for 72-hour time span between 24 and 96 h after p53 restoration. f Quantification of cell population doublings 72 h after 4-OHT treatment. Each symbol represents the mean of n = 3 technical replicates per Type V cell line (4711-11, 4716-10, 4716-14). g Quantification of BrdU+ cells 72 h after 4-OHT treatment. Symbols represent independent Type V cell lines (n = 3; 4711-11, 4716-10, 4716-14). h Brightfield photomicrographs of SA-β-Gal stained Type V cells representative of three independent Type V cell lines. Scale bars, 25 μm; insets are magnified 5×. i Immunoblot analysis for apoptosis markers in Type V (4716-10, 4716-14) and Type D (4711-18, 4716-11) cells 4 days after 4-OHT treatment. Positive control (TCS) treated with TNF-α (1 μg/mL), Smac mimetic (SM-164; 100 nM), and cyclohexamide (10 μg/mL) for 8 h. GAPDH is loading control. j Quantification of flow cytometry-assisted TUNEL staining in Type D (n = 3) cells. Symbols represent independent Type D cell lines (4711-1, 4711-18, 4716-11). Each symbol represents the mean of n = 3 technical replicates per Type D cell line. Error bars represent mean ± s.d. k Type D (4711-18) cells were treated with 4-OHT and specific cell death inhibitors for 72 h. Percentage of live cells (DAPI-) were determined using flow cytometry. Each symbol represents a technical replicate (n = 3). Statistical significance was determined by two-tailed Student’s t-test. Error bars represent mean ± s.d. Experiment was conducted in n = 2 independent Type D cell lines. l Type D (4711-18) cell line was treated with 4-OHT and cyclophilin (CsA, NIM-811) or FKBP (FK506) inhibitors for 72 h. Percentage of live cells (DAPI-) were determined using flow cytometry. Each symbol represents mean of technical replicates (n = 3). Statistical significance was determined by one-way ANOVA followed by Dunnett’s multiple comparison test. Error bars represent mean ± s.d. Data represent n = 3 independent experiments. m Individual tumor volume analysis using µCT. Waterfall plot percentage change from baseline in control (n = 3), restored (n = 3), and restored + CsA (n = 5) mice after 15 days of treatment. n Quantification of percentage regression of tumors in (m). n = 17 regressing tumors from n = 3 mice treated with tamoxifen; n = 13 regressing tumors from n = 3 mice treated with tamoxifen and CsA. Error bars represent mean ± s.d. Statistical significance determined by one-tailed Student’s t-test. Source data are provided as a Source Data file.

