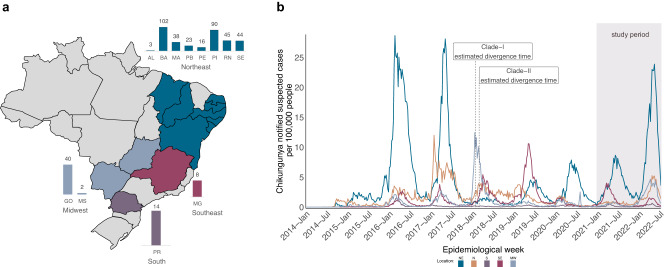
Fig. 1. Spatiotemporal distribution of chikungunya fever (CHIKF) in Brazil.
a Map of Brazil displays states colored according to the location where samples were collected and sequenced. Bar plots indicate the number of isolates obtained from each state. States abbreviations: AL = Alagoas, BA = Bahia, MA = Maranhão, PB = Paraíba, PE = Pernambuco, PI = Piauí, RN = Rio Grande do Norte, SE = Sergipe, MG = Minas Gerais, PR = Paraná, GO = Goiás, MS = Mato Grosso do Sul. b Time series of monthly reported CHIKF suspected cases normalized per 100 K individuals in five Brazilian macroregions over 2014–2022 (until epidemiological week 28). Epidemic curves are colored according to geographical macroregion: N = North, NE = Northeast, MW = Midwest, SE = Southeast, S = South. The shaded rectangle indicates the period in which samples were collected for this study. See “Data availability” for Source data.

