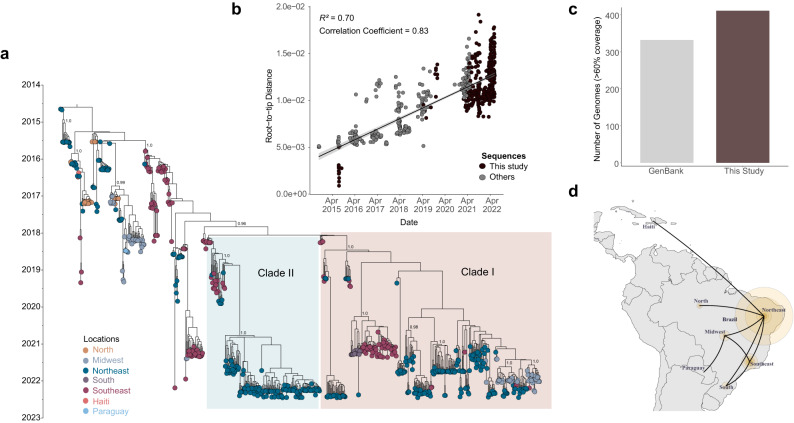
Fig. 2. Time-measured phylogeny of chikungunya virus ECSA lineage in Brazil.
a Maximum Clade Credibility tree reconstructed using 706 sequences from Brazil (in addition to 5 sequences from Paraguay and 2 from Haiti) and a molecular clock approach. Numbers in black show clade posterior probabilities of main nodes. Some posterior probability values were omitted for clarity. Tip colors represent the sampling location. b Root-to-tip genetic distance regression in a maximum likelihood phylogeny of the CHIKV ECSA lineage (n = 713). New sequences are colored in black. The black line represents the medium values of the linear regression while the light gray bands around the line represent the standard error. R2 indicates the coefficient of determination. c Number of genomes generated in this study (with >60% genome coverage) compared to the number of Brazilian CHIKV ECSA sequences available on the GenBank up to 27th Jan. 2023. d The spatial spread of CHIKV in Brazil estimated, using SPREAD4 software, under a discrete diffusion model employed in the Bayesian Phylogeographic approach using a dataset with 471 sequences. Size of colored circles was scaled by location posterior support. See Data Availability for Source data.

