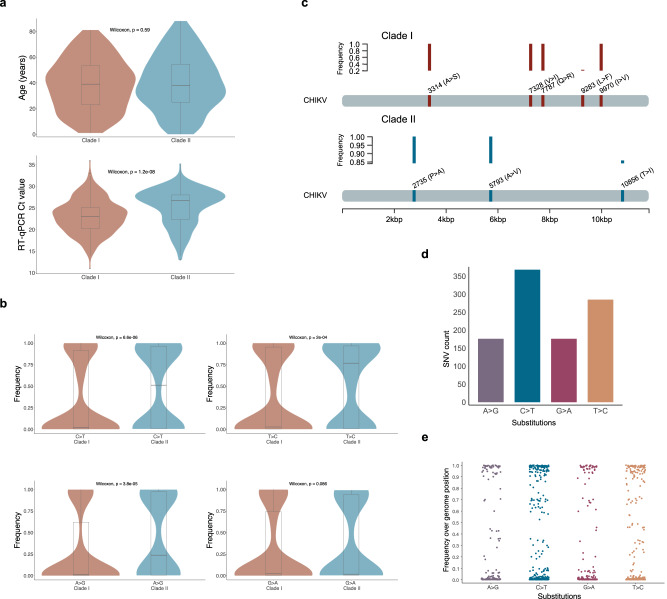
Fig. 3. Genetic and demographic aspects of the newly generated chikungunya virus (CHIKV) sequences.
a Violin plot and boxplot of the patient’s age and samples’ cycle threshold (Ct) value distributions by clades I (n = 255 biologically independent samples) and II (n = 147 biologically independent samples). Mann–Whitney U (Wilcoxon) two-sided test with a significance level alpha = 0.05. b Violin plots and boxplots of the frequency distributions for each class of single nucleotide variation (SNV) identified across genome positions of sequences from clades I (n = 327 biologically independent samples) and II (n = 168 biologically independent samples). Mann–Whitney U (Wilcoxon) two-sided test with a significance level alpha = 0.05. a, b Data visualized as violin plots (outer shape representing the data kernel density) and box-and-whisker plots (box represents the median value and 25 and 75% quartiles, the whiskers display the minimum and maximum values, 1.5x interquartile range; points, outliers). c Genomic positions and frequency (represented by plotted bars) of the non-synonymous substitutions uniquely identified in the sequences from clades I and II. Numbers represent the genomic position of each substitution. d Bar plot of the absolute number of CHIKV genome mutated positions for each class of single nucleotide variation (SNV) identified in the alignment of the new CHIKV sequences (n = 422 biologically independent samples). e Scatterplot of the frequency distributions for each class of single nucleotide variation (SNV) identified in the alignment of the new CHIKV sequences (n = 422 biologically independent samples). Each dot represents the frequency of a distinct mutated genome position. b, d, e Letters in the x-axis represent nucleotides: A—adenine, G—guanine, C—cytosine, T—thymine. See “Data availability” for Source data.

