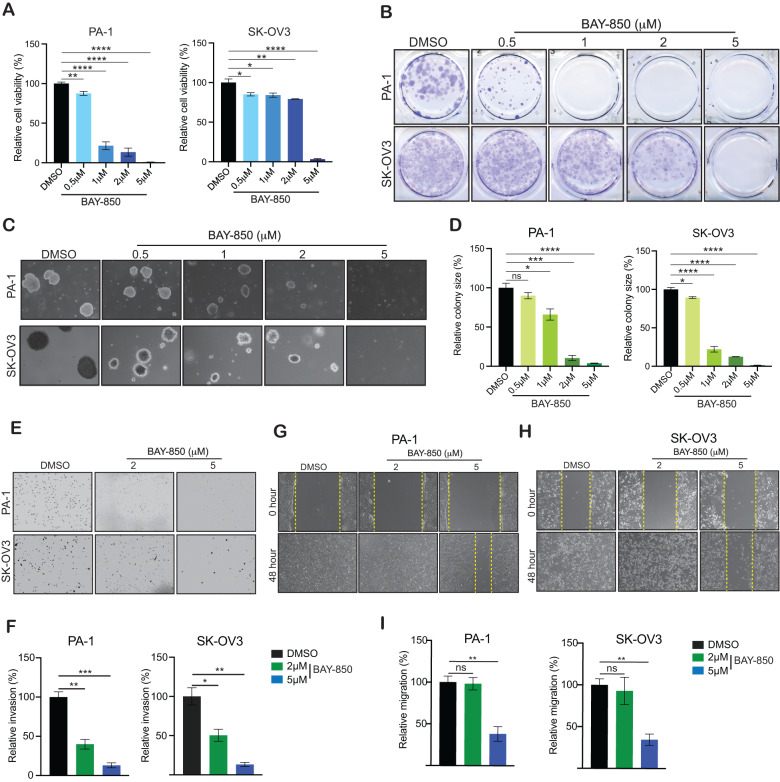
Fig. 2. ATAD2 targeting inhibits ovarian cancer tumor growth.
A The indicated ovarian cancer cell lines were treated with various concentrations of BAY-850 for 3 days, and survival was assessed by 3-(4,5-dimethylthiazol-2-yl)-2,5-diphenyltetrazolium bromide (MTT) assay. Cell survival is presented relative to the survival of DMSO-treated cells. B The indicated ovarian cancer cell lines were treated with various concentrations of BAY-850 for 2–4 weeks. Cell survival was measured using clonogenic assays. Representative images are shown. C The indicated ovarian cancer cell lines were treated with various concentrations of BAY-850 and analyzed for their abilities to grow in soft-agar assays. Representative images are shown; scale bar, 500 µm. D Relative colony sizes for the images shown in (C). E The indicated ovarian cancer cell lines were treated with various concentrations of BAY-850 and analyzed for invasive ability using Matrigel-based Boyden chamber assays. Representative images are shown; scale bar, 200 µm. F Percentage invasion for the images shown in (E). G, H Migration was analyzed in a wound-healing assay for ovarian cancer cell lines, PA-1 (G) and SK-OV3 (H), treated with various concentrations of BAY-850. Representative images are shown; scale bar, 200 µm. I Quantitation of the data presented in (G, H). Data represent the mean ± standard error for three biological replicates. *p < 0.05, **p < 0.01, ***p < 0.001, ****p < 0.0001, ns: not significant.

