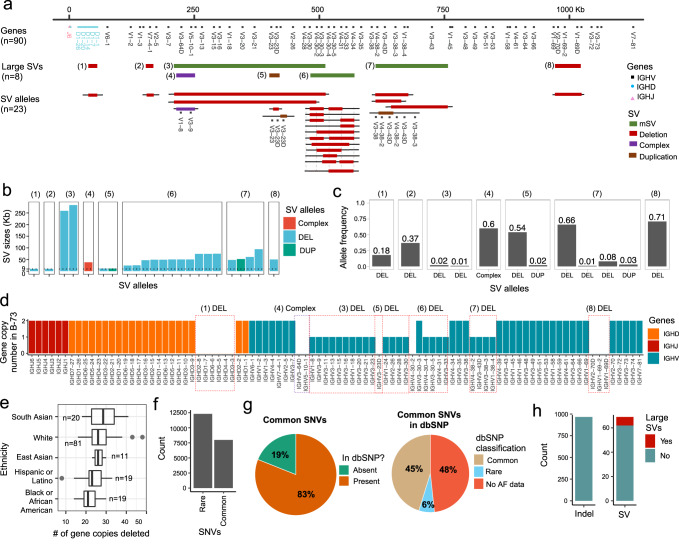
Fig. 1. IGH genetic variation identified by long-read sequencing in a cohort of 154 individuals.
a Map of the IGH locus with annotation tracks shown in the following order (top to bottom): joining (IGHJ), diversity (IGHD) and variable (IGHV) genes, structural variants (SV) and SV alleles. The numbers assigned to each SV serve as a unique identifier, distinguishing one SV from another. These numbers are consistently referenced throughout the figures to identify each SV. b The sizes for each SV allele. All SVs have at least 1 allele greater than 9 Kbp (black dotted line, y axis). c The frequency of alleles for each SV. The allele frequencies for mSV/(6) is not shown. d Diploid gene copy number of genes in an individual carrying multiple homozygous and hemizygous deletions; deleted genes are indicated (red boxes; n = 36). e Boxplots showing the number of genes deleted for every individual in the cohort grouped by self-reported ethnicity; whiskers and boxes represent the minimum, the maximum, the median, and the first and third quartiles, with outliers plotted as points. f Number of characterized SNVs with a minor allele frequency ≥0.05 (common) and <0.05 (rare). g Number of common SNVs identified in the study cohort present/absent in dbSNP. A large proportion (54%) of common SNVs identified here using long-read sequencing were missing, defined as rare (6%), or had no allele frequency data in dbSNP (48%). h The total count of indels (2–49 bps) and SVs identified (≥50 bps). SV structural variant, IGHV IGH variable, IGHD IGH diversity, IGHJ IGH joining, mSV multi-allelic structural variant, DEL deletion.

