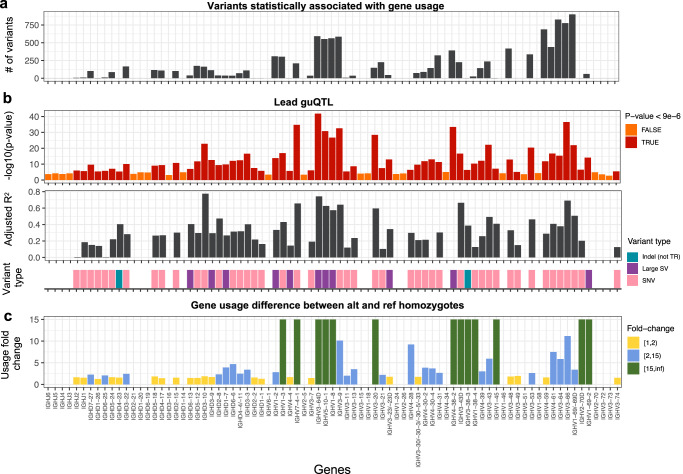
Fig. 2. IGH variants impact gene usage in the IgM repertoire.
Per gene (x axis, all panels) statistics from guQTL analysis (ANOVA and linear regression) in the IgM repertoire, including: a the number of associated variants (P < 9e−6 threshold after Bonferroni correction); b the (i) −log10(P value) of the lead guQTL, (ii) adjusted R2 for variance in gene usage explained by the lead guQTL and (iii) the variant type for the lead guQTL; and c the fold change in gene usage between genotypes at the lead guQTL. Summary statistics are provided in Supplementary Data 4.

