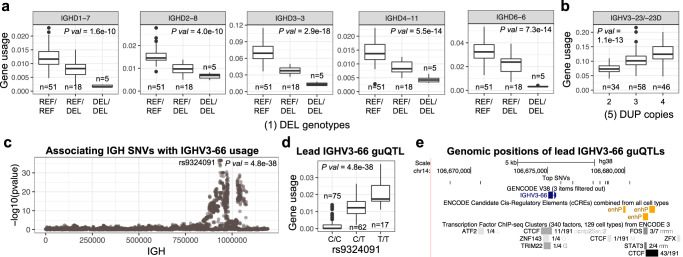
Fig. 3. Associations of IGH SVs and SNVs with gene usage in the IgM repertoire.
a Gene usage for genes within the IGHD gene region deletion (see Fig. 1a, b). Individuals homozygous for the deletion (“DEL/DEL”) use those genes at lower frequencies than the rest of the cohort. b Gene usage for IGHV3-23/-23D in individuals partitioned by gene copy number (see Fig. 1a, b). Individuals carrying more gene copies use these genes at higher frequencies. c SNVs associated with the usage of IGHV3-66 using linear regression. The Manhattan plot shows the −log10(P value) for all SNVs in the IGH locus tested for IGHV3-66; there are 10 lead SNVs/guQTLs with the same P value (P value = 4.8e−38). Dark red SNVs are those SNVs that passed Bonferroni correction (P value < 9e−6). d IGHV3-66 usage in individuals partitioned by genotypes at 1 of the 10 lead guQTLs. e Genomic localization (hg38; GRCh38) of lead guQTLs (top track) relative to IGHV3-66, as well as cCRE and TF locations (middle and bottom tracks). Genomic map was made using the UCSC Genome Browser (https://genome.ucsc.edu/). Boxplots display the median, 25th percentile, 75th percentile, and whiskers that extend up to 1.5 times the inter-quartile range (IQR) from the respective percentiles. Data points outside the whiskers are also plotted. DUP duplication.

