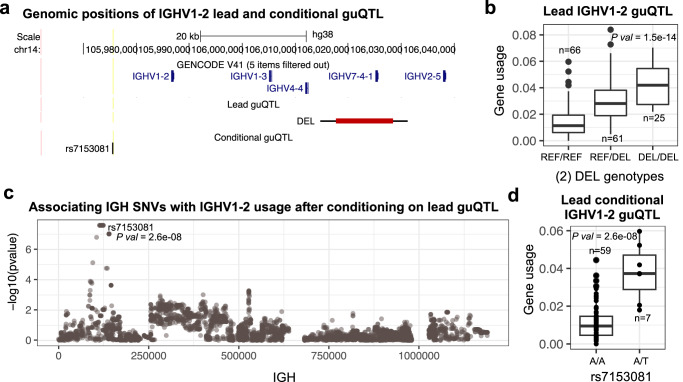
Fig. 4. Example of additional variants associated with gene usage after conditioning on lead guQTL.
a Map showing positions of the lead and conditional guQTLs for IGHV1-2 (bottom tracks). b IGHV1-2 usage in individuals partitioned by SV genotype; individuals homozygous for the IGHV7-4-1 deletion have greater IGHV1-2 usage on average. c Manhattan plot showing the statistical significance of all SNVs tested for secondary effects on IGHV1-2 gene usage using linear regression (red indicates Bonferroni corrected significant SNVs), after conditioning on genotype at the IGHV7-4-1 SV. d IGHV1-2 usage among individuals of the “REF/REF” IGHV7-4-1 SV genotype (b), partitioned by genotype at the secondary guQTL (c). Boxplots display the median, 25th percentile, 75th percentile, and whiskers that extend up to 1.5 times the inter-quartile range (IQR) from the respective percentiles. Data points outside the whiskers are also plotted.

