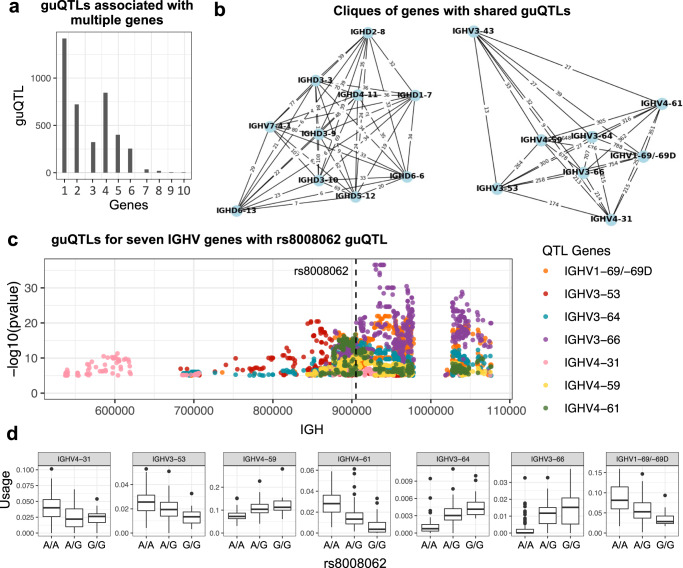
Fig. 5. guQTL network analysis reveals coordinated genetic effects on gene usage patterns.
a Bar plot showing the number of SNVs (guQTLs) significantly associated (linear regression; P value < 9e−6) with varying numbers of genes (n = 1–10); this includes a large number of SNVs that were associated with >1 gene (see Fig. 2). b Examples of cliques identified from a comprehensive network of genes and guQTLs (see also Supplementary Figs. 14 and 15), demarcating groups of genes associated with overlapping sets of guQTLs. For each clique, genes are shown as nodes, connected by edges displaying the number of shared guQTLs. c Manhattan plot showing statistically significant SNVs (linear regression; P value < 9e−6) associated with the usage of 7 genes; each point is colored by the gene it is associated with. The position of an SNV (rs8008062) associated with all 7 genes is indicated by the dashed line. d Boxplots show usage variation for each gene partitioned by genotypes at this SNV. The number of individuals with A/A, A/G and G/G genotypes is 61, 69, and 24, respectively. Boxplots display the median, 25th percentile, 75th percentile, and whiskers that extend up to 1.5 times the inter-quartile range (IQR) from the respective percentiles. Data points outside the whiskers are also plotted.

