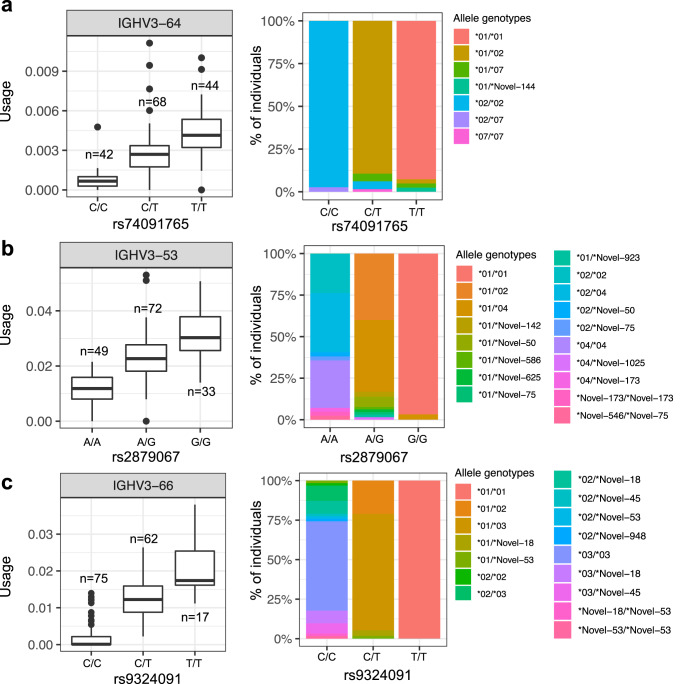
Fig. 7. Association between IGHV coding region alleles and lead guQTL genotypes.
a–c For each IGHV gene, the distribution of coding region allele-level genotypes among individuals partitioned by genotype at the lead guQTL for that gene was assessed (Fisher’s exact test). For the three genes with the lowest P values from this analysis (a; IGHV3-64, b; IGHV3-53 and c; IGHV3-66), IgM gene usage (boxplots) and the distributions (stacked bar plots) of the respective coding allele genotypes across individuals partitioned by guQTL genotype are provided. Boxplots display the median, 25th percentile, 75th percentile, and whiskers that extend up to 1.5 times the inter-quartile range (IQR) from the respective percentiles. Data points outside the whiskers are also plotted.

