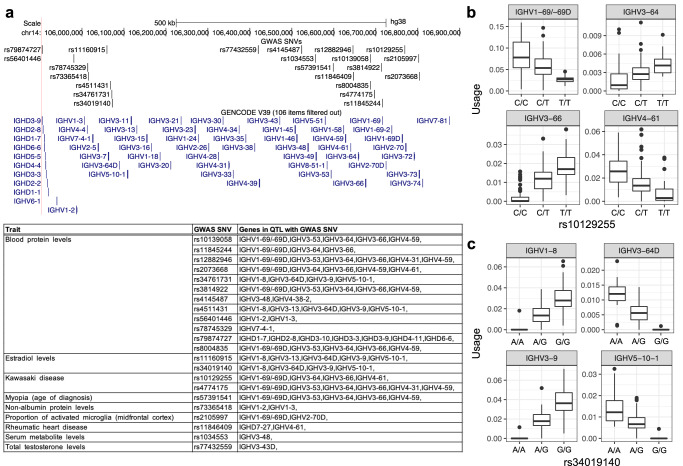
Fig. 8. SNVs associated with diseases and other clinical traits are also associated with gene usage variation.
a Map of IGH (GRCh38) showing the positions of SNVs identified by genome-wide association studies (GWAS); positions of F/ORF genes are also provided. For each GWAS SNV found to overlap a guQTL (IgM and IgG) from our dataset, the table provides information on the trait, SNV identifier, and genes for which usage was associated with the GWAS/guQTL SNV. b, c Boxplots showing gene usage variation for all genes associated with two GWAS SNVs for (b) Kawasaki disease and (c) estradiol levels. The number of individuals with C/C, C/T, and T/T genotypes for rs10129255 is 67, 67, and 20, respectively. For rs34019140, the numbers are 23, 79, and 52 for A/A, A/G, and G/G genotypes, respectively. Boxplots display the median, 25th percentile, 75th percentile, and whiskers that extend up to 1.5 times the inter-quartile range (IQR) from the respective percentiles. Data points outside the whiskers are also plotted.

