Figure 3.
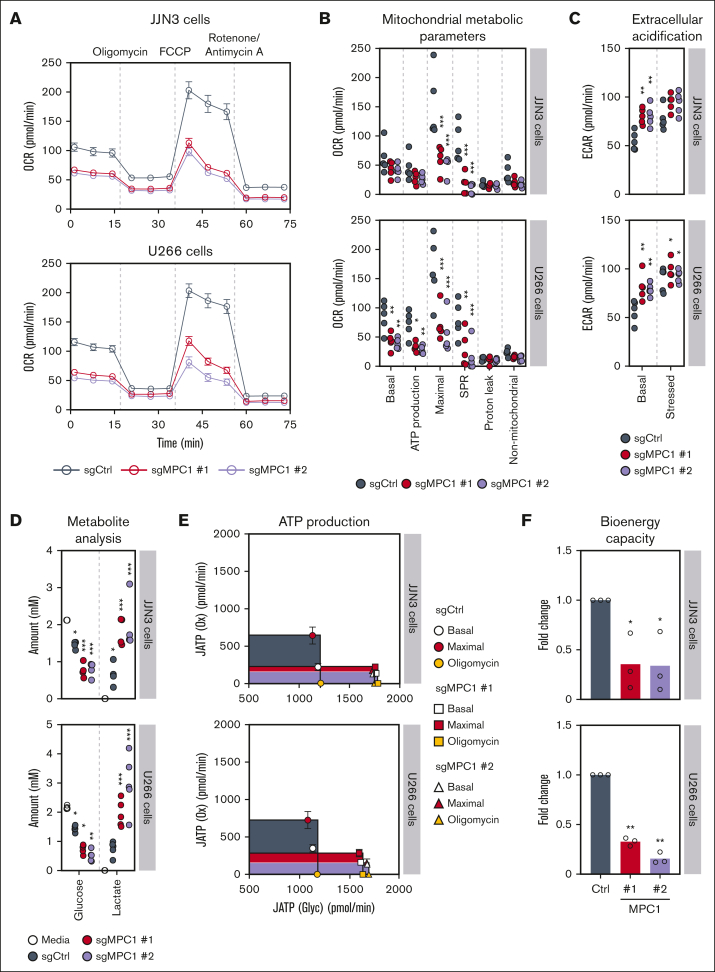
The MPC complex is required for bioenergetic capacity of MM cells. (A) OCR monitored by the Seahorse XF96 extracellular flux analyzer in JJN3 and U266 cells (n = 5). (B) Analysis of the different mitochondrial metabolic parameters obtained from the OCR in panel A. Significance was determined using two-way ANOVA followed by a Dunnett test. ∗P ≤ .05; ∗∗P ≤ .005; ∗∗∗P < .0001. (C) Quantification of basal ECAR and stressed ECAR in JJN3 and U266 cells (n = 5). Significance was determined using two-way ANOVA followed by a Dunnett test. ∗P ≤ .05; ∗∗P ≤ .005. (D) Media metabolite analysis of JJN3 (n = 4) and U266 cells (n = 5), with a focus on extracellular glucose and lactate. Significance was determined using two-way ANOVA followed by a Dunnett test. ∗P ≤ .05; ∗∗P ≤ .005; ∗∗∗P < .0001. (E) The metabolic capacity and flexibility of cells were represented by plotting the basal, oligomycin-treated, and maximal rates of ATP production from glycolysis (JATP gly) and oxidative phosphorylation (JATP ox), upon MPC1 knockout in both JJN3 and U266 cells (n = 5). (F) Fold change in the bioenergetic capacity and of cells described in panel A (n = 5). Significance was determined using two-way ANOVA followed by a Dunnett test. ∗P ≤ .05. OCR, oxygen consumption rate.

