Figure 6.
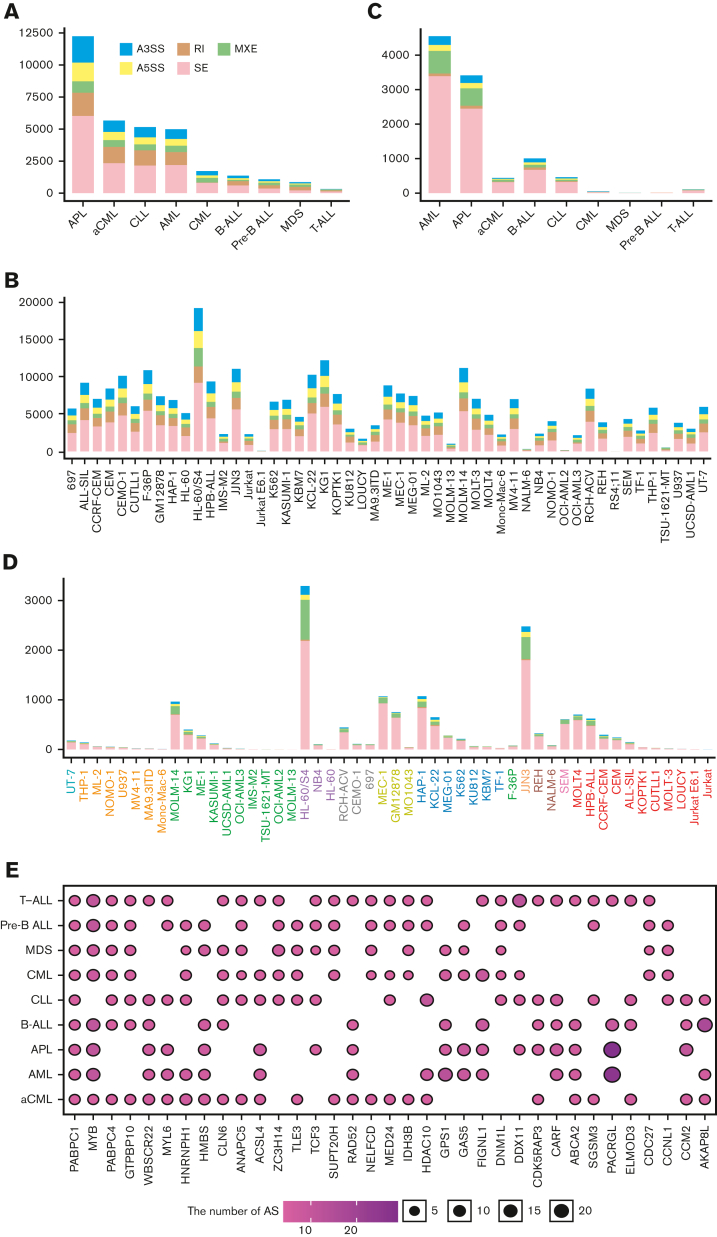
Landscape of AS events. (A-B) The number of AS events with a high splicing ratio (splicing ratio >0.9) in (A) patients with leukemia and (B) leukemia cell lines. (C-D) The number of specific AS events in (C) patients with leukemia and (D) leukemia cell lines. (E) Top 10 frequently spliced genes of each AS event in each leukemia subtype.

