

Summary
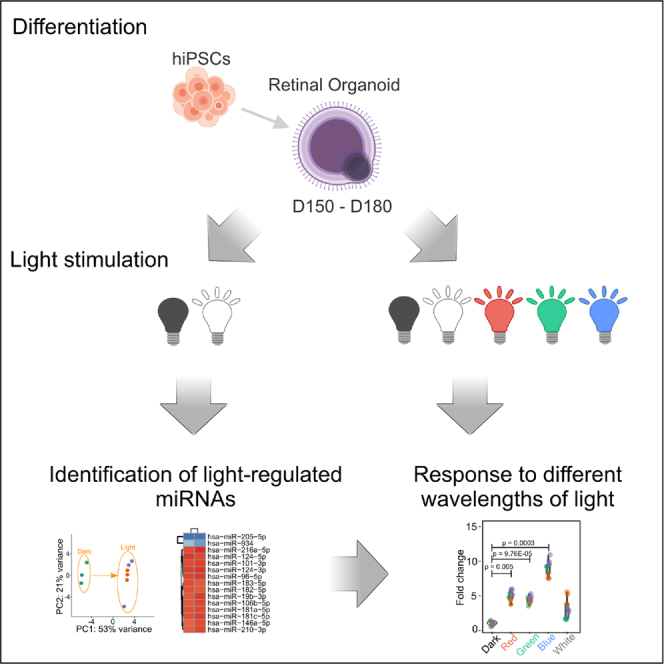
Cells in the human retina must rapidly adapt to constantly changing visual stimuli. This fast adaptation to varying levels and wavelengths of light helps to regulate circadian rhythms and allows for adaptation to high levels of illumination, thereby enabling the rest of the visual system to remain responsive. It has been shown that retinal microRNA (miRNA) molecules play a key role in regulating these processes. However, despite extensive research using various model organisms, light-regulated miRNAs in human retinal cells remain unknown. Here, we aim to characterize these miRNAs. We generated light-responsive human retinal organoids that express miRNA families and clusters typically found in the retina. Using an in-house developed photostimulation device, we identified a subset of light-regulated miRNAs. Importantly, we found that these miRNAs are differentially regulated by distinct wavelengths of light and have a rapid turnover, highlighting the dynamic and adaptive nature of the human retina.
Subject areas: Biotechnology, Applied sciences
Graphical abstract
Highlights
-
•
Human retinal organoids express majority of miRNAs typically found in developing retina
-
•
MiRNAs are differentially expressed in response to light
-
•
Light-regulated miRNAs have a rapid turnover in human retinal tissue
-
•
MiRNAs respond differently to distinct wavelengths of light
Biotechnology; Applied sciences
Introduction
The retina is a specialized, light-sensitive neural tissue that lines the inner surface of the eye. It is composed of several layers of neurons that convert incident light into electrical signals, which are transmitted to the brain for visual perception. The outermost layer of the retina, the photoreceptor layer, comprises two distinct types of photoreceptor cells: rods and cones. Rods are primarily responsible for vision under low-light conditions, while cones are responsible for color vision and visual acuity during daylight conditions. The retina also contains other specialized cell types including bipolar, horizontal, retinal ganglion, and Müller cells. The development and function of the retina is intricately regulated by various factors including hormones, growth factors, transcription factors, and miRNA molecules. Recent research has demonstrated that miRNAs play a crucial role in regulating light-induced processes in mice retina, including adaptation to different light intensities and regulation of circadian genes,1,2 however, nothing is known about retina-specific miRNAs in human retina.
MiRNAs represent a class of small non-coding regulatory RNAs, 18–24 nucleotides in length that are found in all metazoans.3 They act as post-transcriptional regulators of gene expression by maintaining cellular and tissue homeostasis, controlling development, and signaling pathways.4 MiRNA expression appears to be highly influenced by the tissue specificity representing the key regulatory elements of virtually all cell processes underlying a cell function. Notably, many miRNAs are specifically expressed in the retina, giving rise to a unique miRNA expression profile in retinal tissue.3,5,6
It has been established that miRNAs play a critical role in regulating the expression of genes essential for photoreceptor development and function.2 Additionally, they act as crucial regulators of light-sensitive processes within the retina. In mammals, light regulates the amplitude and duration of the daytime by modulating the activity of several key light-sensitive proteins, including the opsins and melanopsin.7,8,9 Several studies have demonstrated that miRNAs exhibit differential expression in the retina in response to light exposure.1,3 One well-studied group of light-regulated miRNAs is the miR-182/183/96 cluster, which contains three miRNAs: miR-182, miR-183, and miR-96. This cluster is upregulated in the retina during light adaptation and its overexpression leads to increased cell proliferation and neurogenesis.1,10 Additionally to its role in neurogenesis, miR-183 also plays a role in protecting the retina from light-induced damage by reducing oxidative stress through targeting and degrading the key protein SIRT1.11 Moreover, the miR-182/183/96 cluster is also implicated in the development of retinal pigment epithelium and circadian rhythms regulation.3,12,13
Despite the recognized importance of light-regulated miRNAs in the retina, their functions are not yet fully understood, particularly in humans. This is due to the difficulty of studying miRNAs in the human retina, as the availability of human retinal tissue for experimental procedures is limited. Retinal organoids, which mimic the cellular composition and function of the human retina, represent a promising model for studying light-regulated miRNAs in humans.
Here, we employed retinal organoids derived from human pluripotent stem cells as a tool to closely investigate light-regulated miRNAs in the human retina. We developed a device capable of photostimulating retinal organoids using various intensities and wavelengths of light. By utilizing this device, we photostimulated retinal organoids and identified 51 light-regulated miRNAs. Further analysis revealed that these miRNAs exhibited a rapid turnover and differential responses to distinct wavelengths of light. Our findings indicate that human retinal organoids represent a valuable tool for studying light-regulated miRNAs and open new avenues for research on light-regulated miRNA targets, the adaptation of the human retina to light, and the regulation of light-regulated circadian rhythms in humans.
Results
Generation of light-responsive human retinal organoids
In the first experiment, we aimed to determine the stage of the retinal organoid differentiation process that is applicable for studying light-regulated miRNAs. We generated light-responsive retinal organoids from human induced pluripotent stem (hiPS) cells, as previously described (Figure 1A).14,15 We harvested retinal organoids at different stages of the maturation process (D90, D120, D150, and D180) and assessed the expression of opsins (OPN1SW, OPN1MW, OPN1LW, and RHODOPSIN) and miRNAs (miR-96-5p, miR-182-5p, and miR-183-5p) that have been previously shown to be expressed in the retina.5,16,17 We observed a significant upregulation of opsins at D150 and a significant upregulation of the selected miRNAs from D120 to D180, when compared to D90 (Figure 1B).
Figure 1.

Characterization of light-responsive retinal organoids
(A) Schematic presentation of the differentiation protocol.
(B) Expression of OPN1SW, OPN1MW, OPN1LW, RHODOPSIN, and retina-specific miR-96-5p, miR-182-5p, miR-183-5p during retinal organoid differentiation, as determined by RT-qPCR (n = 3).
(C) Expression of NeuN, PKCalpha, Rhodopsin, S-Opsin, and CRALBP, as demonstrated using immunofluorescence staining. Scale bars = 20 μm.
(D) Raster plots (top panels), firing rate histograms (bottom panels, bin size = 1 s) from RGCs which showed a 25% increase (ON responses) or decrease (OFF responses) in spiking activity in the presence of pulsed light or 100 μM 8-br-cGMP. In the raster plot, each small vertical bar indicates the time stamp of a spike, where each row represents a different RGC. The rate histogram illustrates the number of spikes per defined time window (here 1 s) divided by the total number of RGCs. The left half illustrates the activity before stimulus onset and, separated by the red line, the right half the activity when the organoids are exposed to pulsed light or 100 μM 8-br-cGMP.
Next, we aimed to determine whether the generated retinal organoids contained major cell types typically found in the retina. We performed indirect immunofluorescent staining on cross-sections (at D180). The generated retinal organoids contained a laminated retina, retinal ganglion cells (NeuN+), bipolar cells (PKCα+), photoreceptors (Rhodopsin+, S-Opsin+), and Müller glia (CRALBP+) (Figure 1C). Taken together, our data indicate that the generated retinal organoids between D150-D180 express opsins, retina-specific miRNAs, and contain major cell types typically found in the retina. Therefore, all the analyses in this study were done using organoids between D150-D180 of the differentiation process.
Finally, using multielectrode array (MEA) approach, we aimed to assess whether the generated retinal organoids are light-responsive and are capable to electrophysiologically respond to photostimulation. Light responses from RGCs (exhibiting at least 25% increase or decrease in spiking activity after the stimulus onset) are illustrated in Figure 1D, revealing response patterns somewhat akin to those seen in immature mouse RGCs, just before eye opening, at P10-11.14 In order to confirm that the light responses observed in organoids were caused by phototransduction in photoreceptors rather than intrinsically photosensitive RGCs, we conducted experiments involving the application of cGMP onto the organoids. cGMP is a secondary messenger in the phototransduction cascade that opens Na+-permeable channels in the outer segments of photoreceptors. By puffing 8-br-cGMP, a membrane-permeable analog of cGMP, into the recording chamber, we triggered Na+ influx and depolarization of photoreceptors, which mimics the dark current. We identified ON RGCs that responded to the 8-br-cGMP puff with reduced spiking activity, indicating that they are photoreceptor-driven. Additionally, we recorded from cells that exhibited increased firing rate following cGMP puffs, which were likely OFF RGCs (Figure 1D).
Retinal organoids express retina-specific miRNAs
We conducted next-generation sequencing (NGS) of miRNAs to identify miRNA molecules expressed in retinal organoids. We compared the generated NGS data with a previously published list of retina-specific miRNAs.18 We detected 56 miRNAs (out of 60) that have been previously reported to be expressed in the developing retina (Figure 2A). These 56 miRNAs represent approximately 67% of all mapped miRNA reads in human retinal organoids. Since a significant proportion of miRNA genes occur in defined clusters, and typically act as families with the same seed sequence, we clustered all detected miRNAs into miRNA clusters and families. This analysis revealed that retinal organoids express miRNA families and clusters that are often involved in regulating neuronal or retinal cell fate (Figure 2B). We identified these miRNA families to be the most abundant: mir-9 (involved in neuronal differentiation,19), let-7 (promotes terminal cell differentiation,20,21), mir-7 (promotes photoreceptor differentiation,22), mir-26 (controls neuronal differentiation,23), mir-125 (regulates neuronal differentiation and proliferation,24). The most abundant miRNA clusters were the miR-7/1179/3529, let-7a/d/f, and miR-183/96/182 clusters (over 15% of total mapped miRNA reads). Members of these clusters have been previously shown to be expressed in the retina or neural tissues.5,16,17 Taken together, these data indicate that retinal organoids express majority of miRNAs that have been previously shown to be expressed in developing retina.
Figure 2.

Retinal organoids express retina-specific miRNAs
(A) Heatmap showing the expression of retina-specific miRNAs in human retinal organoids. R1, R2, and R3 represent different replicates.
(B) Abundance of miRNA families and clusters present in retinal organoids.
Retinal organoids are responsive to photostimulation at miRNA transcriptional level
To study the effects of photostimulation on miRNA expression in human retinal organoids, we developed Cell LighteR, a photostimulation system capable of controlled, high-throughput, and versatile stimulation of cells cultured in 96-well plates with superior temporal precision. The photostimulation platform consists of a control unit containing a power supply and an Arduino (https://www.arduino.cc/) microcontroller that drives individual light emitting diodes (LEDs) (Figures S1A and S1D). The control unit is connected to the LED module using a thin wire, and the LED module is placed into an incubator. Emitted light from the LED array in the LED module is directed to individual wells of a black 96-well plate, ensuring that it does not influence neighboring wells (Figure S1B). The plate containing organoids is positioned on top of the LED module and covered with a black lid. The device allows for high-throughput experiments, as it can control up to 3x96-well plates (288 wells) simultaneously. Each LED is individually addressable, allowing for easy, precise, and simultaneous modulation of multiple parameters such as luminous intensity, frequency, and three distinct wavelengths of monochromatic light to deliver adjustable light outputs to organoids in individual wells (Figure S1C). Cell LighteR is equipped with RGB LED chips (type 5050), capable of emitting distinct wavelengths of monochromatic light in the red, green, and blue portions of the spectrum (emitting maximum RED [620–625 nm]; GREEN [522–525 nm]; BLUE [465–467 nm]), allowing for the study of the contribution of individual parts of the spectrum to the effects of photostimulation (Figures S1C and S1E).
To ensure that the photostimulation of the retinal organoids was performed at a physiological level and did not induce apoptosis or overheating of the organoid culture, we conducted a series of experiments to determine the appropriate level of luminous intensity. These experiments included assessing the expression levels of the genes involved in apoptosis (PUMA, BIM) upon photostimulation and measuring changes in the temperature of the culture media during the photostimulation process. Organoids were placed in a black 96-well plate containing cell culture media and positioned on an LED module inside an incubator. The organoids were photostimulated using different luminous intensities (15, 50, 500, and 4200 lx) of white light and harvested 3 h after the start of the photostimulation process. We did not observe a significant upregulation of PUMA expression at 500 and 4200 lx, and BIM expression remained unchanged across all the luminous intensities tested (Figure S1G). Therefore, for short-term photostimulation of retinal organoids, we used a luminous intensity of 100 lx. To determine changes in temperature during the photostimulation, we utilized a digital thermometer equipped with ultra-thin sensors (Dallas Instruments) to continuously monitor the temperature. One sensor was immersed in the culture media in a 96-well plate that was being photostimulated, while the second sensor was placed in another 96-well plate kept in the dark. The temperature difference did not exceed 0.3°C during the measurement, indicating that there was no overheating of the cell culture media during the photostimulation process (Figure S1F).
Having determined the miRNA expression profile of human retinal organoids and the physiological level of luminous intensity for the photostimulation process, we aimed to identify at what stage the retinal organoids become photo-responsive and react to light at miRNA transcriptional level. We photostimulated retinal organoids at different stages of the differentiation process (D90, 120, 150, and 180) using white light at 100 lx and assessed the expression of the miR-182/183/96 cluster that has been previously shown to be upregulated upon light stimulation in mice.1 We found that photostimulation of organoids at D90 does not upregulate this cluster, however, at later stages (D120 and more) there was a significant upregulation of the miR-182/183/96 cluster upon photostimulation, indicating that retinal organoids at D120 and more are photo-responsive at miRNA transcriptional level (Figure 3A).
Figure 3.

Retinal organoids demonstrate transcriptional responsiveness to photostimulation at the miRNA level
(A) Expression of individual members of the miR-183/182/96 cluster 3 h upon photostimulation using white light (100 lx) at different stages of the differentiation process, as determined using RT-qPCR (n = 3). D = dark, L = white light at 100 lx for 3 h.
(B) Principal component analysis (PCA) of miRNA expression profiles in retinal organoids following 1 h and 3 h of photostimulation.
(C) Heatmap illustrates miRNAs that were significantly up- or down-regulated upon photostimulation.
(D) Analysis of miRNA families and clusters that are significantly down-regulated upon photostimulation. Error bars show mean ± SEM (n = 3).
(E) Analysis of miRNA families and clusters that are significantly up-regulated upon photostimulation. Error bars show mean ± SEM (n = 3).
(F) Functional annotation of all significantly up-regulated miRNAs upon photostimulation, as determined using the TAM 2.0 tool.
Next, we aimed to identify miRNA molecules that are light-responsive. We photostimulated retinal organoids for 1 h and 3 h, respectively, using white light at 100 lx of luminous intensity and performed miRNA NGS. Principal component analysis of the NGS data revealed that the miRNA expression profile differed between the dark and light conditions, while there was no difference between the 1 h and 3 h of photostimulation time-points, and the replicates clustered together (Figure 3B). Differential expression analysis revealed 51 miRNAs that were significantly up- or down-regulated (padj < 0.05 in both time-points) upon photostimulation (Figure 3C), while there was no induction of apoptosis or oxidative stress, as demonstrated by non-significant change in the expression of genes involved in apoptosis and DNA damage (BIM, BAX, BCL2, PUMA, and TP53) or genes involved in oxidative damage response (DUOX1, GSS) (Figures S2A and S2B). Clustering analysis revealed that only two miRNA families (mir-124 and mir-216) and three miRNA clusters (miR-182/183/96, miR-216a/217, and miR-29a/29b-1/29b) were significantly upregulated (Figure 3D), while eight miRNA families and ten clusters were downregulated upon photostimulation (Figure 3E). Functional annotation revealed that the significantly upregulated miRNAs play a role in multiple cellular functions including circadian rhythms, neural differentiation, regulation of Wnt signaling pathway, and DNA damage (Figure 3F). Since mir-124 and mir-216 families are significantly upregulated upon photostimulation, we aimed to assess the expression of their experimentally validated target genes that were shown to be expressed in the retina. We searched miRTarBase—a database of experimentally validated miRNA targets25 and selected three target genes for each family (mir-124: CSGALNACT1, LMAN2L, FAM89A; mir-216: GRIN2A, SDR16C5, NNT).26,27,28 We found that all genes were downregulated upon photostimulation, however, only CSGALNACT1 and GRIN2A were downregulated significantly (Figures S4A and S4B).
Taken together, only a small number of miRNA molecules are differentially expressed upon photostimulation in retinal organoids, suggesting that only a small subset of miRNA clusters and families are involved in the reaction of the human retina to light.
Light-regulated miRNAs have rapid turnover and respond to different wavelengths of light
Since a small subset of miRNAs is responsive to light, we aimed to select representative miRNA molecules for detailed expression analysis. We selected nine different miRNAs that were shown to be up- or down-regulated upon photostimulation: miR-96-5p, miR-182-5p, and miR-183-5p representing the retina-specific miR-182/183/96 cluster; miR-204-5p and miR-211-5p as members of the mir-204 family; miR-145-5p as a member of the miR-143/145 cluster; miR-196a-5p as a representative of the mir-196 family; miR-214-3p as a member of the mir-214 family; and miR-205-5p as the most down-regulated miRNA upon photostimulation.
We aimed to assess the expression turnover of the selected miRNAs during alternating periods of darkness and photostimulation. Retinal organoids were cultured in darkness for 24 h and then exposed to white light at a luminous intensity of 100 lx for 60 min. The light was then switched off and the organoids were cultured in darkness for an additional 60 min. Samples were harvested at 15-min or 30-min intervals, as depicted in Figure 4A. The miR-182/183/96 cluster, miR-204-5p, and miR-211-5p were gradually upregulated during the photostimulation period, with the highest expression observed at the 60-min time point. Upon switching off the light, expression gradually decreased, returning to levels observed in darkness after 30 min (Figure 4A). Conversely, miRNAs that were shown to be downregulated upon photostimulation, including miR-205-5p, miR-214-3p, miR-196a-5p, and miR-145-5p, were gradually downregulated and reached their lowest expression between 30 and 60 min of photostimulation. Upon switching off the light, expression of these miRNAs returned to their original levels as observed in darkness (Figure 4A). These results indicate that the light-regulated miRNAs have a rapid turnover in human retinal tissue.
Figure 4.

Light-regulated miRNAs display rapid turnover and exhibit distinct responses to different colors of light
(A) Expression of miRNAs during alternating periods of darkness and light, as determined by RT-qPCR.
(B) Expression of miRNAs upon photostimulation using different wavelengths of light at 100 lx for 1 h, as determined by RT-qPCR.
(C) miRNA in situ hybridization upon exposure to blue light at 100 lx for 1 h, as determined by miRNA scope. ONL—presumptive outer nuclear layer, INL—presumptive inner nuclear Layer, GCL—presumptive ganglion cell layer. Scale bars = 100 μm.
There is an intriguing question as to whether these miRNAs respond differently to distinct wavelengths of light. To address this question, we photostimulated retinal organoids using distinct wavelengths of light (RED [620–625 nm], GREEN [522–525 nm], and BLUE [465–467 nm]) (Figure S1B). As each channel in the RGB LED has a different light power (Figure S1C), we adjusted individual channels to a luminous intensity of 100 lx. Interestingly, red and green light were identified as the strongest inducers of the members of the miR-182/183/96 cluster, while blue light was the strongest inducer of the mir-204 family, as both members, miR-204-5p and miR-211-5p, were upregulated using blue light. Surprisingly, we did not observe any strong association between the level of downregulation of miRNAs and the color of light, as all miRNAs (miR-205-5p, miR-214-3p, miR-196a-5p, miR-145-5p) were downregulated in all conditions.
Next, we aimed to evaluate the spatial expression of miRNAs in retinal organoids using in situ miRNA hybridization (miRNA scope). Intriguingly, blue light had the greatest effect on the upregulation of the mir-204 family members and on the downregulation of the miR-145-5p (Figure 4B), therefore we aimed to determine the localization and expression of the miR-204-5p and the miR-145-5p in retinal organoids photostimulated using the blue light (100 lx for 1 h). In the dark condition, both miRNAs were predominantly localized in the presumptive inner nuclear layer (INL). Upon photostimulation, miR-204-5p expression was highly upregulated in the presumptive ganglion cell layer (GCL) and outer nuclear layer (ONL), while miR-145-5p expression was downregulated in the INL (Figure 4C). These findings suggest that retinal ganglion cells and photoreceptors upregulate miR-204-5p expression, while miR-145-5p expression decreases in cells present in the INL.
Discussion
In this study, we identified miRNAs that respond to photostimulation in the human retina using retinal organoids as a model. We showed that retinal organoids express a number of retina-specific miRNA families and clusters that have been previously associated with the regulation of neuronal or retinal cell fate, including miR-9, let-7, miR-7, miR-26, and miR-125.18 To study the light-regulated miRNAs, we developed a photostimulation system, Cell LighteR, and used it to stimulate the organoids with light of different wavelengths. We showed that retinal organoids are responsive to photostimulation at the miRNA transcriptional level, as evidenced by the altered expression of multiple miRNA families and clusters in response to light exposure. Furthermore, our research revealed that many miRNAs in the retina have a high turnover rate, much faster than miRNAs expressed in other cell types or tissues.1 Importantly, some miRNAs exhibit distinct responses to various wavelength ranges of light. In particular, exposure to red and green light strongly induced expression of the miR-183/182/96 cluster, while blue light exposure upregulated the expression of the members of the miR-204 family.
To the best of our knowledge, our study is the first to report light-regulated miRNAs in human retinal organoids, providing new insights into the regulation of light-induced transcription and light adaptation in the human retina. However, some light-responsive neuronal miRNAs have already been identified in mice.1,29 Krol et al.1 identified neuronal miRNAs that are downregulated during dark adaptation and upregulated in light-adapted mice retinas. Surprisingly, despite using multiple approaches, including Exiqon arrays and Illumina sequencing, they identified only five light-responsive miRNAs (miR-96, miR-182, miR-183, and both members of the mir-204 family miR-204, and miR-211). However, here we identified over 10-fold more light-responsive miRNAs. The striking difference can be explained by (I) the deeper sequencing used in our study with the number of miRNA reads per sample ranging from 1.7 to 3.1 million (Figure S3); (II) different experimental setups; (III) diverse experimental models. Despite the difference between the numbers of miRNAs identified, the miR-183/182/96 cluster and the mir-204 family were recognized as light-regulated miRNAs in both studies. Here, we provide a more comprehensive list of light-regulated miRNAs in humans that includes a detailed cluster analysis, a functional annotation analysis, an expression turnover assessment, and an analysis of the effects of different wavelengths of light on light-regulated miRNAs, further expanding our knowledge about light-regulated miRNAs in human retina.
Interestingly, many light-responsive miRNAs are not among the abundantly expressed miRNA families or clusters in retinal organoids. This could be due to the photostimulation using 100 lx being ineffective in regulating these miRNAs. Conversely, excessively high luminous intensity may cause damage such as oxidative stress or apoptosis. Another possibility is that the abundantly expressed miRNAs have a different essential role in the retina and are not light responsive. Notably, the only miRNA cluster that was both abundantly expressed and light responsive was the miR-182/183/96 cluster.
Previously, our laboratory demonstrated that the miR-182/183/96 cluster is an important morphogenetic factor in human retinal organoids that target PAX6 expression.10 Other studies have shown that this miRNA cluster is involved in the development of photoreceptor outer segments, synapses and retinal laminar structure.30,31,32,33 Furthermore, the voltage-dependent glutamate transporter Slc1a1 is targeted by the miR-182/183/96 cluster, and under low glutamate conditions, Slc1a1 can clear glutamate from the photoreceptor synaptic area. This miRNA cluster is also implicated in maintaining cone outer segments by regulating genes related to membrane trafficking, lipid metabolism, and cilia formation.34 Given the critical role of the miR-182/183/96 cluster in the retina and its responsiveness to light, it is possible that light stimulation will play an important role in shaping the post-natal retina.
The miRNA oscillatory pattern is a highly conserved mechanism and has significant consequences for circadian timing.35 Here, we identified nine light-regulated miRNAs—hsa-mir-96, hsa-mir-194-2, hsa-mir-181a-1, hsa-mir-194-1, hsa-mir-182, hsa-mir-183, hsa-mir-192, hsa-mir-181a-2, and hsa-miR-124—that are linked to the regulation of circadian rhythms.3,36 Besides the well-known cluster miR-182/183/96 that targets critical circadian genes including ADCY6, CLOCK, and BMAL1,3,37 the miR-194/192 cluster has been found to target other circadian genes including PER1, PER2, and PER3.38,39 Interestingly, the miR-124 represents an important regulator of Drosophila circadian locomotor rhythms and under dark conditions flies lacking miR-124 (miR-124KO) have a greatly enhanced circadian behavior phase.40 Similarly, it has been shown that miR-124 mutants’ advanced circadian phase functionally connects with the suppression of miR-124 targets in BMP signaling.41 Although some light-regulated miRNAs are regulated independently of the circadian rhythms,1 they may still play a critical role as circadian regulators that can quickly respond to rapidly changing light stimuli.
The quick turnover of miRNAs in retinal neurons and the resulting fast changes in target gene expression can enhance the precise encoding of visual stimuli in a rapidly changing environment.33 Our study provides new insights into the regulation of miRNA expression in response to light in the human retina. The discovery of wavelength-specific miRNA responses and the high turnover rate of miRNAs in the retina highlight the importance of deeper sequencing methods in identifying miRNAs, and can guide future research on the functional analysis of these miRNAs in order to understand their role in the regulation of light-induced transcription and light adaptation in the human retina. Light-regulated miRNAs have significant implications for the formation and function of the retina, as well as for circadian timing. This work paves the way to study the complex interplay between light and miRNA regulation in the retina and its effects on visual function and circadian rhythms.
Limitations of the study
This study aimed to characterize light-regulated miRNAs in human retinal tissue using a human retinal organoid model. While retinal organoids provide a reliable representation of human retinal development and function, it is important to note that these structures may not fully replicate all the functional properties of the human retina.
STAR★Methods
Key resources table
| REAGENT or RESOURCE | SOURCE | IDENTIFIER |
|---|---|---|
| Antibodies | ||
| Mouse monoclonal Rhodopsin antibody | SantaCruz | Cat# sc-57432; RRID:AB_785511 |
| Rabbit polyclonal S Opsin/BCP | Abcam | Cat# ab229786 |
| NeuN (D4G4O) XP Rabbit mAb | Cell Signaling Technology | Cat# 24307S; RRID:AB_2651140 |
| Mouse monoclonal PKC α antibody | Santa Cruz | Cat# sc-8393; RRID:AB_628142 |
| Mouse monoclonal CRALBP Antibody (B2) | Santa Cruz | Cat# sc-59487; RRID: AB_782256 |
| Goat anti-Mouse IgG (H + L), Superclonal Recombinant Secondary Antibody, Alexa Fluor™ 488 | Invitrogen | Cat# A28175; RRID:AB_2536161 |
| Goat anti-Rabbit IgG (H + L) Cross-Adsorbed Secondary Antibody, Alexa Fluor 594 | Invitrogen | Cat# A-11012; RRID:AB_2534079 |
| Chemicals, peptides, and recombinant proteins | ||
| 2-Mercaptoethanol | Sigma-Aldrich | Cat# M3148 |
| Taurine | Sigma-Aldrich | Cat# T8691 |
| Retinoic Acid | Sigma-Aldrich | Cat# R2625 |
| Triton X-100 | Sigma-Aldrich | Cat# T8787 |
| Goat Serum | Sigma-Aldrich | Cat# G9023 |
| Fluoromount Aqueous Mounting Medium | Sigma-Aldrich | Cat# F4680 |
| Bovine serum albumin | Sigma-Aldrich | Cat# A9647 |
| 1-bromo-3-chloropropane | Sigma-Aldrich | Cat# B62404 |
| KnockOut Serum Replacement | Gibco | Cat# 10828-028 |
| N-2 supplement | Gibco | Cat# 17502001 |
| GlutaMAX supplement | Gibco | Cat# 35050061 |
| Tissue-Tek O.C.T. Compound | Sakura Finetek | Cat# 4583 |
| Penicillin- Streptomycin Solution | Biosera | Cat# XC-A4122 |
| RNA Blue Reagent | Top-Bio | Cat# R013 |
| Recombinant Human BMP-4 | Peprotech | Cat# 120-05ET |
| Fetal Bovine Serum | Biosera | Cat# FB-1101 |
| GlutaMAX supplement | Gibco | Cat# 35050061 |
| Critical commercial assays | ||
| TaqMan MicroRNA Assay | Applied Biosystems | Cat# 4427975 |
| High-Capacity cDNA Reverse Transcription Kit | Applied Biosystems | Cat# 4368814 |
| PowerUp SYBR Green Master Mix | Applied Biosystems | Cat# A25741 |
| TaqMan MicroRNA Reverse Transcription Kit | Applied Biosystems | Cat# 4366596 |
| TaqMan Universal PCR Master Mix | Applied Biosystems | Cat# 4304437 |
| NEBNext Multiplex Small RNA Library Prep Set for Illumina | New England Biolabs | Cat# E7300S; Cat# E7580S |
| Human Pluripotent Stem Cell Transcription Factor Kit | BD Biosciences | Cat #560589 |
| NextSeq 500/550 High Output Kit v2.5 | Illumina | Cat# 20024906 |
| miRNAscope HD (Red) Assay | ACDBio | Cat# 324500 |
| RNA Blue Reagent, Direct-zolTM RNA Microprep kit | Zymo Research | Cat# R2062 |
| Epi5 Episomal iPSC Reprogramming Kit | Invitrogen | Cat# A15960 |
| Deposited data | ||
| Non-coding RNA profiling by high throughput sequencing | Illumina NextSeq 500 | GEO accession: GSE223379 |
| qPCR results | Mendeley | https://doi.org/10.17632/8ksg9fssd9.1 |
| Experimental models: Cell lines | ||
| hiPSC cell line | Derived from neonatal fibroblasts CC-2509 (Lonza) | Neo5 |
| Oligonucleotides | ||
| Full list of RT-qPCR primers is presented in Table S1 and S2. | This paper | N/A |
| Software and algorithms | ||
| LightCycler 480 SW 1.5 | ||
| BD FACSDiva™ software v6.1.3 | Becton Dickinson | https://www.bdbiosciences.com/en-de/products/software/instrument-software/bd-facsdiva-software#Overview |
| ZEN 3.6 (blue edition) | Zeiss | https://www.zeiss.com/microscopy/en/products/software/zeiss-zen.html |
| FlowJo | BD Biosciences | https://www.bdbiosciences.com/en-us/products/software/flowjo-v10-software |
| RStudio | Rstudio | https://www.rstudio.com/ |
| ggplot2 | Wickham, H., 201651 | https://ggplot2.tidyverse.org/ |
| Cutadapt v2.5 | Martin, 201141 | https://cutadapt.readthedocs.io/en/stable/ |
| FASTX-Toolkit v0.0.14 | Langmead, B., Trapnell, C., Pop, M.et al., 201944 | http://hannonlab.cshl.edu/fastx_toolkit/ |
| FastQC v0.11.9 | Andrews, 201039 | http://hannonlab.cshl.edu/fastx_toolkit/ |
| Bowtie v1.3.1 | Langmead and Salzberg, 201257 | https://bowtie-bio.sourceforge.net/bowtie2/index.shtml |
| miRBase v22.1 | Kozomara, Ana et al., 201945 | https://www.mirbase.org/ |
| seqcluster v1.2.8 | Bioconductor | https://github.com/lpantano/seqcluster |
| R v3.6.3 | Team, R.C., 202048 | https://cran.r-project.org/ |
| DESeq2 v1.24.0 | Love et al., 201449 | https://bioconductor.org/packages/release/bioc/html/DESeq2.html |
| Other | ||
| Essential 8™ Medium | Gibco | Cat # A1517001 |
| Iscove's modified Dulbecco's medium | Gibco | Cat #21980-032 |
| Ham’s F12 | Gibco | Cat #21765-029 |
| DMEM/F12 | Gibco | Cat #21331-020 |
| SR-RNU6-S1 | ACDBio | Cat #727871-S1 |
| SR-Scramble-S1 | ACDBio | Cat #727881-S1 |
| SR-mmu-miR-204-5p-S1 | ACDBio | Cat #885551-S1 |
| SR-hsa-145-5p-S1 | ACDBio | Cat #727671-S1 |
Resource availability
Lead contact
Further information and requests for resources and reagents should be directed to and will be fulfilled by the lead contact, Tomas Barta (tbarta@med.muni.cz).
Materials availability
This study did not generate new unique reagents.
Experimental model and study participant details
hiPS cell lines
Neonatal dermal fibroblasts (purchased form Lonza, Product code: CC-2509) were reprogrammed using an Epi5™ Episomal iPSC Reprogramming Kit (Invitrogen) according to the manufacturer’s instructions. hiPS cells (Neo5) were maintained in Essential 8 medium (Gibco) on Vitronectin-coated dishes and regularly passaged every ∼ 4-5 days. hiPS cells between passages 40-60 were used in this study. Cell line characterization was done using flow cytometry analysis of SOX2 and OCT3/4 expression (Figure S5).
Method details
Retinal organoids generation
Retinal organoids were generated using the previously reported protocols14,15 with slight modifications. HiPS cells cultured in Essential 8 medium (Gibco) were seeded into a U-shaped, cell-repellent 96-well plate (5000 cells/well), (Cellstar). After 48 hours (day 0 of the differentiation process), the culture medium was changed to a growth factor-free chemically defined medium (gfCDM) containing 45% Iscove’s modified Dulbecco’s medium (IMDM, Gibco), 45% Ham’s F12 (F12, Gibco), 10% KnockOut Serum Replacement (Gibco), 1% chemically defined lipid concentrate (Gibco), 1% Penicillin-Streptomycin Solution (Biosera), 10 μM β mercaptoethanol (Sigma-Aldrich). On day 6, recombinant human BMP4 (Peprotech) was added to the culture to the final concentration 1.5 nM and then the medium was changed every third day. On day 18 of the differentiation process, gfCDM was changed to a NR medium containing DMEM/F12 (Gibco), 1% N-2 supplement (Gibco), 1% GlutaMAX supplement (Gibco), 10% foetal bovine serum (FBS; Biosera), 0.5 mM retinoic acid (Sigma), 0.1 mM Taurine (Sigma), 1% Penicillin- Streptomycin Solution (Biosera). The organoids were cultured in 96-well plates to day 18 and then they were transferred to 10 cm Petri dish.
Photo-stimulation of retinal organoids
Twelve hours before the photo-stimulation the retinal organoids were transferred to ultra-low attachment, black 96-well plate with a clear round bottom (Corning) into the fresh culture media (one organoid per well). The LED module was placed into a conventional tissue incubator and the 96-well plate containing the organoids was positioned onto the LED module and covered with a black lid. A source code that controls the individual LEDs was compiled and uploaded into the Arduino UNO microcontroller (https://www.arduino.cc) (Figure S1).
Electrophysiological recordings
Electrophysiological recording were performed as described previously.14 The organoids (at D180) were placed in artificial cerebrospinal fluid (aCSF), containing: 118 mM NaCl, 25 mM NaHCO3, 1 mM NaH2PO4, 3 mM KCl, 1 mM MgCl2, 2 mM CaCl2, 10 mM glucose, and 0.5 mM L-Glutamine. The aCSF was equilibrated with 95% O2 and 5% CO2. The organoids were then longitudinally opened and placed with the presumed RGC layer facing down onto a 4096 channel multielectrode array (MEA). A translucent polyester membrane filter (Sterlitech Corporation, Kent, WA) was used to flatten the organoids. The organoids were allowed to settle for a minimum of 2 hours. Recordings were performed on the BioCam4096 MEA platform with BioChips 4096S+ (3Brain GmbH, Lanquart, Switzerland). The platform contained 4096 square microelectrodes in a 64 × 64 array configuration. Spike extraction was done using a quantile-based event detection method.42 An automated spike sorting method for dense, large-scale recordings was used to sort single-unit spikes.43 Statistical analysis and firing rate analysis were conducted using Prism (GraphPad) and MATLAB (MathWorks, Natick, MA). In order to elicit the strongest light-induced responses in organoids, we exposed them to white light pulses (pulsed light: 200 ms duration, 217 μW/cm2 intensity, 1 Hz frequency) for a period of 5 minutes, following a 5-minute recording of their spontaneous activity in darkness.44 The RGC responses were sorted based on their main response polarity using the bias index (BI) calculation. To measure the BI, the relative amplitude of ON and OFF responses were determined (A1 and A2, respectively), and the formula (A1 − A2)/(A1 + A2) was used. cGMP (8-Bromoguanosine 3′,5′-cyclic monophosphate, Sigma-Aldrich, St. Louis, MO) was puffed into the recording chamber at a final concentration of 100 μM. Activity was recorded continuously for 6 minutes, starting with the spontaneous activity recording (baseline, 2min) followed by the cGMP puff recording (2min) and a second baseline recording (2min).
RNA isolation
Organoids were harvested in a dark room, maintaining a controlled luminous intensity ranging from 1.6 to 5 lx, as measured using the BH1750 light sensor (Adafruit, NYC, USA). Furthermore, the entire lysis procedure was performed within a time frame not exceeding 5 minutes. At least 6 organoids per sample were washed with phosphate-buffered saline (PBS), and were homogenized using a 1 ml insulin syringe in 300 μl RNA Blue Reagent (an analogue of Trizol) (Top-Bio). After the addition of 1-bromo-3-chloropropane (Sigma-Aldrich) and centrifugation (21000 g, 15 minutes, 4°C), the cell lysates were separated into three layers. The top aqueous layer containing RNA was transferred to a new tube and precipitated by the addition of isopropanol, followed by 10 minutes incubation on ice and centrifugation (18000 g, 10 minutes, 4°C). RNA pellets were washed with 70% ethanol (8500 g, 10 minutes, 4°C), air-dried, solubilized in PCR grade water (Top-Bio). For reverse transcription quantitative real-time PCR (RT-qPCR), after the organoids were homogenized using a 1 ml insulin syringe in 300 μl RNA Blue Reagent, Direct-zolTM RNA Microprep kit (Zymo Reseach) was used according to the manufacturer’s instructions and as described previously.45
RT-qPCR analysis
RNA was reverse transcribed using a High-Capacity cDNA Reverse Transcription Kit (Applied Biosystems). The RT product was amplified using the LightCycler 480 Real-Time PCR system (Roche) using PowerUp SYBR Green Master Mix (Applied Biosystems). Primer sequences are shown in Table S1. Data sets were normalized to the corresponding levels of GAPDH mRNA. To determine miRNA expression, the RNA was reverse transcribed (16oC, 30 minutes; 42oC, 30 minutes; 85oC, 5 minutes) using a TaqMan MicroRNA Reverse Transcription Kit (Applied Biosystems) using specific primers (Applied Biosystems), (Table S2). Reverse transcription products were then amplified using the LightCycler 480 Real-Time PCR system (95oC, 5 minutes; 95oC, 15 seconds; 60oC, 60 seconds; 40 cycles) using TaqMan Universal PCR Master Mix and specific probes for miRNAs (Applied Biosystems), (Table S2). Relative microRNA expression was determined using the ΔΔCt method and normalized to endogenous control RNU6B.
Small RNA library preparation and sequencing
RNA quality was assessed using TapeStation 2200 (RNA Screen Tape; Agilent Technologies), and only the samples with RINe values ≥ 9 were used for library preparation. NEBNext Multiplex Small RNA Library Prep Set (New England Biolabs) was used to prepare the libraries for further sequencing according to the manufacturer’s instructions. Briefly, 800 ng of total RNA were used to create size selected small RNA libraries (size selection with 6% PAGE gel). The sequencing was performed with a 2.0 pM library using the NextSeq® 500/550 High Output Kit v2.5 (75 cycles; Illumina).
miRNAScope assay and immunohistochemistry
The organoids were fixed in 4% paraformaldehyde for 30 minutes at room temperature, washed three times with PBS, cryopreserved in 30% sucrose (Sigma Aldrich) in PBS overnight at 4oC, embedded in Tissue-Tek O.C.T. Compound medium (Sakura), and sectioned on a cryostat (Leica CM1850) (∼10 μm) using Superfrost PlusTM Adhesion Microscope slides (Epredia).
In situ hybridization (ISH) assay was performed using a miRNAscopeTM HD (Red) Assay (ACDBio) following the fixed-frozen tissue sample protocol provided by the manufacturer. Briefly, the slides were washed with PBS to remove O.C.T. and treated with hydrogen peroxide (ACDBio) for 10 min at room temperature, followed by a 10-fold diluted (in PBS) Protease III treatment for 40 min at 40°C in a HybEZ Oven (ACDBio). Hybridization was performed using probes from ACDBio: SR-RNU6-S1 (positive control), SR-Scramble-S1 (negative control), SR-mmu-miR-204-5p-S1 (target) and SR-hsa-145-5p-S1 (target). Signal amplification and detection reagents (ACDBio) were applied sequentially and incubated in AMP 1, AMP 2, AMP 3, AMP 4, AMP 5, and AMP 6 reagents, for 30, 15, 30, 15, 30, 15 min, respectively. Before adding each AMP reagent, the samples were washed twice with the washing buffer (ACDBio). After probe hybridization and signal amplification, hybridization signals were visualized by chromogenic reactions using FastRed (ACDBio).
For immunofluorescent staining the sections were washed with PBS and blocked with 0.3% Triton X-100 (Sigma Aldrich), 5% normal goat serum (Sigma Aldrich) in PBS for 1 hour at room temperature in a humidified chamber. The primary antibodies were diluted in an antibody diluent containing PBS with 0.3% Triton X-100 and 1% bovine serum albumin (Sigma Aldrich) and applied to the sections overnight at 4°C in a humidified chamber. The following primary antibodies were used: Rhodopsin (SantaCruz, 1:200), S-Opsin (Abcam, 1:200), NeuN (CST, 1:200), PKC-alpha (SantaCruz, 1:200), and CRALBP (SantaCruz, 1:200). The sections were washed with antibody diluent, and secondary antibodies Goat anti-Mouse IgG Alexa 488 (Invitrogen, 1:1000) and Goat anti-Rabbit IgG Alexa 594 (Invitrogen, 1:1000) were applied for 1 hour at room temperature in a humidified chamber. The nuclei were stained with 1 μg/mL DAPI in PBS for 4 minutes at room temperature and the sections were mounted using Fluoromount Aqueous Mounting Medium (Sigma Aldrich).
Flow cytometry analysis
hiPS cells were characterized using a human pluripotent stem cell transcription factor kit (BD Biosciences). hiPS cells were dissociated using 0.5 mM EDTA in PBS and counted with a haemocytometer. The cells were then fixed using cytofix fixation buffer (BD Biosciences) and permeabilized in Perm/wash buffer (BD Biosciences), and then stained with Alexa Flour 647 Sox2 and PerCP-Cy5.5 Oct3/4 antibodies and their isotype controls (BD Biosciences) at RT for 30 min. The cells were washed with Perm/wash buffer and resuspended in PBS and were analysed immediately after labelling using BD FACSAria equipped with BD FACSDiva™ software (v. 6.1.3).
Quantification and statistical analysis
RT-qPCR statistical analysis
All the experiments consisted of at least three independent replicates, and each replicate was performed in triplicate. Individual data points are shown in each graph. p-values were calculated using the two-tailed Student’s t-test. The corresponding significance level (p-value) is provided in each panel. All comparisons with p-value <0.05 were considered significant.
Small RNA-sequencing data processing
The quality of the raw sequencing data was assessed using FastQC (v0.11.9).46 Minion and Swan (Kraken package, v16.098)47 were used to scan and identify adaptor sequences which were subsequently removed by Cutadapt (v2.5).48 Only adapter-containing reads were kept for further processing. The adapter-trimmed reads were further processed using the following steps: 1) removal of very low-quality read ends (Phred<5); 2) keeping only reads with a Phred score of 10 over at least 85% of the length; 3) only reads within 16-27 bp were kept as potential microRNA reads. The FASTX-Toolkit (v0.0.14)49 was used for the quality filtering; the rest of the steps were performed using Cutadapt (v2.5)48 bash scripting. The quality of the final pre-processed reads was assessed with overall mapping rates to the human reference genome (hg38),50 and the general quality of the pre-processed reads was assessed using Bowtie (v1.3.1).51 Reads mapping to rRNAs, tRNAs, snoRNAs, snRNAs, or YRNAs50 with fewer mismatches than to miRNAs (miRBase; v22.1)52 were excluded. The raw microRNA expression levels were quantified using seqcluster (v1.2.8)53 and seqbuster/miraligner (v3.5).54 R (v3.6.3)55 was used for further evaluation and visualization of the data. Differential expression was calculated with DESeq2 (v1.24.0).56 All data analysis and visualizations were conducted using R 3.4.458 with installed Bioconductor project software.57 The following R packages were used to analyze and visualize the data: ggplot2,58 pheatmap,59 RColorBrewer,60 ggstatsplot,.61 The mirbase.db62 package was used to cluster and visualize miRNAs into families and clusters. Functional miRNA annotation was performed using TAM 2.0 web server (http://www.lirmed.com/tam2/).63 A list of non-significantly expressed miRNAs was submitted to the web server for the background analysis.
Acknowledgments
This publication was supported by the Czech Science Foundation (GA21-08182S), and by the Ministry of Health of the Czech Republic, grant nr. NU22-07-00380. PL was supported by national funds from the Ministry of Education, Youth and Sports of the Czech Republic under the European Joint Program for Rare Diseases (Solve-RET 8F20004 No. 825575). We acknowledge the core facility CELLIM supported by the Czech-BioImaging large RI project (LM2023050 funded by MEYS CR) for their support with obtaining the scientific data presented in this paper. We acknowledge the CF Genomics supported by the NCMG research infrastructure (LM2023067 funded by MEYS CR) for their support with obtaining scientific data presented in this paper.
Author contributions
C.C.: Investigation, methodology, validation, visualization, writing-original draft; K.W.: Investigation, methodology, validation, writing – review & editing; K.A.C.: Investigation, validation; J.O.: Formal analysis, data curation, writing – review & editing; B.D.: Investigation, data curation, writing – review & editing; F.M.G.: Investigation, data curation; J.S.: Investigation, validation; M.L.: Data curation, writing – review & editing; E.S.: Data curation, writing – review & editing; P.L.: Resources, investigation, writing – review & editing; T.B.: Formal analysis, methodology, visualization, writing-original draft, writing – review & editing, supervision, project administration, funding acquisition, conceptualization.
Declaration of interests
The authors declare no competing interests.
Published: June 28, 2023
Footnotes
Supplemental information can be found online at https://doi.org/10.1016/j.isci.2023.107237.
Supplemental information
Data and code availability
-
•
Bulk miRNA sequencing data have been deposited at GEO and are publicly available as of the date of publication. Accession numbers are listed in the key resources table. Individual data points from qPCR analysis have been deposited at Mendeley and are publicly available as of the date of publication. The DOI is listed in the key resources table.
-
•
This paper does not report original code.
-
•
Any additional information required to reanalyze the data deposited in this paper is available from the lead contact upon request.
References
- 1.Krol J., Busskamp V., Markiewicz I., Stadler M.B., Ribi S., Richter J., Duebel J., Bicker S., Fehling H.J., Schübeler D., et al. Characterizing light-regulated retinal microRNAs reveals rapid turnover as a common property of neuronal microRNAs. Cell. 2010;141:618–631. doi: 10.1016/j.cell.2010.03.039. [DOI] [PubMed] [Google Scholar]
- 2.Zhu Q., Sun W., Okano K., Chen Y., Zhang N., Maeda T., Palczewski K. Sponge transgenic mouse model reveals important roles for the microRNA-183 (miR-183)/96/182 cluster in postmitotic photoreceptors of the retina. J. Biol. Chem. 2011;286:31749–31760. doi: 10.1074/jbc.M111.259028. [DOI] [PMC free article] [PubMed] [Google Scholar]
- 3.Xu S., Witmer P.D., Lumayag S., Kovacs B., Valle D. MicroRNA (miRNA) transcriptome of mouse retina and identification of a sensory organ-specific miRNA cluster. J. Biol. Chem. 2007;282:25053–25066. doi: 10.1074/jbc.M700501200. [DOI] [PubMed] [Google Scholar]
- 4.Dexheimer P.J., Cochella L. MicroRNAs: From Mechanism to Organism. Front. Cell Dev. Biol. 2020;8:409. doi: 10.3389/fcell.2020.00409. [DOI] [PMC free article] [PubMed] [Google Scholar]
- 5.Hackler L., Jr., Wan J., Swaroop A., Qian J., Zack D.J. MicroRNA profile of the developing mouse retina. Invest. Ophthalmol. Vis. Sci. 2010;51:1823–1831. doi: 10.1167/iovs.09-4657. [DOI] [PMC free article] [PubMed] [Google Scholar]
- 6.Fishman E.S., Louie M., Miltner A.M., Cheema S.K., Wong J., Schlaeger N.M., Moshiri A., Simó S., Tarantal A.F., La Torre A. MicroRNA Signatures of the Developing Primate Fovea. Front. Cell Dev. Biol. 2021;9:654385. doi: 10.3389/fcell.2021.654385. [DOI] [PMC free article] [PubMed] [Google Scholar]
- 7.Hatori M., Panda S. The emerging roles of melanopsin in behavioral adaptation to light. Trends Mol. Med. 2010;16:435–446. doi: 10.1016/j.molmed.2010.07.005. [DOI] [PMC free article] [PubMed] [Google Scholar]
- 8.Besharse J.C., McMahon D.G. The Retina and Other Light-sensitive Ocular Clocks. J. Biol. Rhythms. 2016;31:223–243. doi: 10.1177/0748730416642657. [DOI] [PMC free article] [PubMed] [Google Scholar]
- 9.Tosini G., Pozdeyev N., Sakamoto K., Iuvone P.M. The circadian clock system in the mammalian retina. Bioessays. 2008;30:624–633. doi: 10.1002/bies.20777. [DOI] [PMC free article] [PubMed] [Google Scholar]
- 10.Peskova L., Jurcikova D., Vanova T., Krivanek J., Capandova M., Sramkova Z., Sebestikova J., Kolouskova M., Kotasova H., Streit L., Barta T. miR-183/96/182 cluster is an important morphogenetic factor targeting PAX6 expression in differentiating human retinal organoids. Stem Cell. 2020;38:1557–1567. doi: 10.1002/stem.3272. [DOI] [PubMed] [Google Scholar]
- 11.Ureña-Peralta J.R., Alfonso-Loeches S., Cuesta-Diaz C.M., García-García F., Guerri C. Deep sequencing and miRNA profiles in alcohol-induced neuroinflammation and the TLR4 response in mice cerebral cortex. Sci. Rep. 2018;8:15913. doi: 10.1038/s41598-018-34277-y. [DOI] [PMC free article] [PubMed] [Google Scholar]
- 12.Zhou L., Miller C., Miraglia L.J., Romero A., Mure L.S., Panda S., Kay S.A. A genome-wide microRNA screen identifies the microRNA-183/96/182 cluster as a modulator of circadian rhythms. Proc. Natl. Acad. Sci. USA. 2021;118 doi: 10.1073/pnas.2020454118. e2020454118. [DOI] [PMC free article] [PubMed] [Google Scholar]
- 13.Davari M., Soheili Z.S., Samiei S., Sharifi Z., Pirmardan E.R. Overexpression of miR-183/-96/-182 triggers neuronal cell fate in Human Retinal Pigment Epithelial (hRPE) cells in culture. Biochem. Biophys. Res. Commun. 2017;483:745–751. doi: 10.1016/j.bbrc.2016.12.071. [DOI] [PubMed] [Google Scholar]
- 14.Hallam D., Hilgen G., Dorgau B., Zhu L., Yu M., Bojic S., Hewitt P., Schmitt M., Uteng M., Kustermann S., et al. Human-Induced Pluripotent Stem Cells Generate Light Responsive Retinal Organoids with Variable and Nutrient-Dependent Efficiency. Stem Cell. 2018;36:1535–1551. doi: 10.1002/stem.2883. [DOI] [PMC free article] [PubMed] [Google Scholar]
- 15.Kuwahara A., Ozone C., Nakano T., Saito K., Eiraku M., Sasai Y. Generation of a ciliary margin-like stem cell niche from self-organizing human retinal tissue. Nat. Commun. 2015;6:6286. doi: 10.1038/ncomms7286. [DOI] [PubMed] [Google Scholar]
- 16.Karali M., Persico M., Mutarelli M., Carissimo A., Pizzo M., Singh Marwah V., Ambrosio C., Pinelli M., Carrella D., Ferrari S., et al. High-resolution analysis of the human retina miRNome reveals isomiR variations and novel microRNAs. Nucleic Acids Res. 2016;44:1525–1540. doi: 10.1093/nar/gkw039. [DOI] [PMC free article] [PubMed] [Google Scholar]
- 17.Ryan D.G., Oliveira-Fernandes M., Lavker R.M. MicroRNAs of the mammalian eye display distinct and overlapping tissue specificity. Mol. Vis. 2006;12:1175–1184. [PubMed] [Google Scholar]
- 18.Fishman E.S., Han J.S., La Torre A. Oscillatory Behaviors of microRNA Networks: Emerging Roles in Retinal Development. Front. Cell Dev. Biol. 2022;10:831750. doi: 10.3389/fcell.2022.831750. [DOI] [PMC free article] [PubMed] [Google Scholar]
- 19.Delaloy C., Liu L., Lee J.A., Su H., Shen F., Yang G.Y., Young W.L., Ivey K.N., Gao F.B. MicroRNA-9 coordinates proliferation and migration of human embryonic stem cell-derived neural progenitors. Cell Stem Cell. 2010;6:323–335. doi: 10.1016/j.stem.2010.02.015. [DOI] [PMC free article] [PubMed] [Google Scholar]
- 20.Ramachandran R., Fausett B.V., Goldman D. Ascl1a regulates Müller glia dedifferentiation and retinal regeneration through a Lin-28-dependent, let-7 microRNA signalling pathway. Nat. Cell Biol. 2010;12:1101–1107. doi: 10.1038/ncb2115. [DOI] [PMC free article] [PubMed] [Google Scholar]
- 21.Ding X.C., Slack F.J., Grosshans H. The let-7 microRNA interfaces extensively with the translation machinery to regulate cell differentiation. Cell Cycle. 2008;7:3083–3090. doi: 10.4161/cc.7.19.6778. [DOI] [PMC free article] [PubMed] [Google Scholar]
- 22.Li X., Carthew R.W. A microRNA mediates EGF receptor signaling and promotes photoreceptor differentiation in the Drosophila eye. Cell. 2005;123:1267–1277. doi: 10.1016/j.cell.2005.10.040. [DOI] [PubMed] [Google Scholar]
- 23.Dill H., Linder B., Fehr A., Fischer U. Intronic miR-26b controls neuronal differentiation by repressing its host transcript, ctdsp2. Genes Dev. 2012;26:25–30. doi: 10.1101/gad.177774.111. [DOI] [PMC free article] [PubMed] [Google Scholar]
- 24.Le M.T.N., Xie H., Zhou B., Chia P.H., Rizk P., Um M., Udolph G., Yang H., Lim B., Lodish H.F. MicroRNA-125b promotes neuronal differentiation in human cells by repressing multiple targets. Mol. Cell Biol. 2009;29:5290–5305. doi: 10.1128/mcb.01694-08. [DOI] [PMC free article] [PubMed] [Google Scholar]
- 25.Huang H.Y., Lin Y.C.D., Cui S., Huang Y., Tang Y., Xu J., Bao J., Li Y., Wen J., Zuo H., et al. miRTarBase update 2022: an informative resource for experimentally validated miRNA-target interactions. Nucleic Acids Res. 2022;50:222–230. doi: 10.1093/nar/gkab1079. [DOI] [PMC free article] [PubMed] [Google Scholar]
- 26.Lipchina I., Elkabetz Y., Hafner M., Sheridan R., Mihailovic A., Tuschl T., Sander C., Studer L., Betel D. Genome-wide identification of microRNA targets in human ES cells reveals a role for miR-302 in modulating BMP response. Genes Dev. 2011;25:2173–2186. doi: 10.1101/gad.17221311. [DOI] [PMC free article] [PubMed] [Google Scholar]
- 27.Karginov F.V., Hannon G.J. Remodeling of Ago2-mRNA interactions upon cellular stress reflects miRNA complementarity and correlates with altered translation rates. Genes Dev. 2013;27:1624–1632. doi: 10.1101/gad.215939.113. [DOI] [PMC free article] [PubMed] [Google Scholar]
- 28.Chi S.W., Zang J.B., Mele A., Darnell R.B. Argonaute HITS-CLIP decodes microRNA-mRNA interaction maps. Nature. 2009;460:479–486. doi: 10.1038/nature08170. [DOI] [PMC free article] [PubMed] [Google Scholar]
- 29.Naso F., Intartaglia D., Falanga D., Soldati C., Polishchuk E., Giamundo G., Tiberi P., Marrocco E., Scudieri P., Di Malta C., et al. Light-responsive microRNA miR-211 targets Ezrin to modulate lysosomal biogenesis and retinal cell clearance. Embo j. 2020;39:e102468. doi: 10.15252/embj.2019102468. [DOI] [PMC free article] [PubMed] [Google Scholar]
- 30.Lumayag S., Haldin C.E., Corbett N.J., Wahlin K.J., Cowan C., Turturro S., Larsen P.E., Kovacs B., Witmer P.D., Valle D., et al. Inactivation of the microRNA-183/96/182 cluster results in syndromic retinal degeneration. Proc. Natl. Acad. Sci. USA. 2013;110:E507–E516. doi: 10.1073/pnas.1212655110. [DOI] [PMC free article] [PubMed] [Google Scholar]
- 31.Krol J., Krol I., Alvarez C.P.P., Fiscella M., Hierlemann A., Roska B., Filipowicz W. A network comprising short and long noncoding RNAs and RNA helicase controls mouse retina architecture. Nat. Commun. 2015;6:7305. doi: 10.1038/ncomms8305. [DOI] [PMC free article] [PubMed] [Google Scholar]
- 32.Fan J., Jia L., Li Y., Ebrahim S., May-Simera H., Wood A., Morell R.J., Liu P., Lei J., Kachar B., et al. Maturation arrest in early postnatal sensory receptors by deletion of the miR-183/96/182 cluster in mouse. Proc. Natl. Acad. Sci. USA. 2017;114:4271–4280. doi: 10.1073/pnas.1619442114. [DOI] [PMC free article] [PubMed] [Google Scholar]
- 33.Zelinger L., Swaroop A. RNA Biology in Retinal Development and Disease. Trends Genet. 2018;34:341–351. doi: 10.1016/j.tig.2018.01.002. [DOI] [PMC free article] [PubMed] [Google Scholar]
- 34.Busskamp V., Krol J., Nelidova D., Daum J., Szikra T., Tsuda B., Jüttner J., Farrow K., Scherf B.G., Alvarez C.P.P., et al. miRNAs 182 and 183 are necessary to maintain adult cone photoreceptor outer segments and visual function. Neuron. 2014;83:586–600. doi: 10.1016/j.neuron.2014.06.020. [DOI] [PubMed] [Google Scholar]
- 35.Hansen K.F., Sakamoto K., Obrietan K. MicroRNAs: a potential interface between the circadian clock and human health. Genome Med. 2011;3:10. doi: 10.1186/gm224. [DOI] [PMC free article] [PubMed] [Google Scholar]
- 36.Figueredo D.d.S., Gitaí D.L.G., Andrade T.G.d. Daily variations in the expression of miR-16 and miR-181a in human leukocytes. Blood Cells Mol. Dis. 2015;54:364–368. doi: 10.1016/j.bcmd.2015.01.004. [DOI] [PubMed] [Google Scholar]
- 37.Nirvani M., Khuu C., Utheim T.P., Hollingen H.S., Amundsen S.F., Sand L.P., Sehic A. Circadian rhythms and gene expression during mouse molar tooth development. Acta Odontol. Scand. 2017;75:144–153. doi: 10.1080/00016357.2016.1271999. [DOI] [PubMed] [Google Scholar]
- 38.Wu S., Fesler A., Ju J. Implications of Circadian Rhythm Regulation by microRNAs in Colorectal Cancer. Cancer Transl. Med. 2016;2:1–6. doi: 10.4103/2395-3977.177555. [DOI] [PMC free article] [PubMed] [Google Scholar]
- 39.Nagel R., Clijsters L., Agami R. The miRNA-192/194 cluster regulates the Period gene family and the circadian clock. FEBS J. 2009;276:5447–5455. doi: 10.1111/j.1742-4658.2009.07229.x. [DOI] [PubMed] [Google Scholar]
- 40.Zhang Y., Lamba P., Guo P., Emery P. miR-124 Regulates the Phase of Drosophila Circadian Locomotor Behavior. J. Neurosci. 2016;36:2007–2013. doi: 10.1523/jneurosci.3286-15.2016. [DOI] [PMC free article] [PubMed] [Google Scholar]
- 41.Garaulet D.L., Sun K., Li W., Wen J., Panzarino A.M., O'Neil J.L., Hiesinger P.R., Young M.W., Lai E.C. miR-124 Regulates Diverse Aspects of Rhythmic Behavior in Drosophila. J. Neurosci. 2016;36:3414–3421. doi: 10.1523/jneurosci.3287-15.2016. [DOI] [PMC free article] [PubMed] [Google Scholar]
- 42.Muthmann J.O., Amin H., Sernagor E., Maccione A., Panas D., Berdondini L., Bhalla U.S., Hennig M.H. Spike Detection for Large Neural Populations Using High Density Multielectrode Arrays. Front. Neuroinform. 2015;9:28. doi: 10.3389/fninf.2015.00028. [DOI] [PMC free article] [PubMed] [Google Scholar]
- 43.Hilgen G., Sorbaro M., Pirmoradian S., Muthmann J.O., Kepiro I.E., Ullo S., Ramirez C.J., Puente Encinas A., Maccione A., Berdondini L., et al. Unsupervised Spike Sorting for Large-Scale, High-Density Multielectrode Arrays. Cell Rep. 2017;18:2521–2532. doi: 10.1016/j.celrep.2017.02.038. [DOI] [PubMed] [Google Scholar]
- 44.Hilgen G., Pirmoradian S., Pamplona D., Kornprobst P., Cessac B., Hennig M.H., Sernagor E. Pan-retinal characterisation of Light Responses from Ganglion Cells in the Developing Mouse Retina. Sci. Rep. 2017;7:42330. doi: 10.1038/srep42330. [DOI] [PMC free article] [PubMed] [Google Scholar]
- 45.Peskova L., Cerna K., Oppelt J., Mraz M., Barta T. Oct4-mediated reprogramming induces embryonic-like microRNA expression signatures in human fibroblasts. Sci. Rep. 2019;9:15759. doi: 10.1038/s41598-019-52294-3. [DOI] [PMC free article] [PubMed] [Google Scholar]
- 46.Andrews S. FastQC: A Quality Control Tool for High Throughput Sequence Data. 2010. https://www.bioinformatics.babraham.ac.uk/projects/fastqc/
- 47.Davis M.P.A., van Dongen S., Abreu-Goodger C., Bartonicek N., Enright A.J. Kraken: a set of tools for quality control and analysis of high-throughput sequence data. Methods (San Diego, Calif.) 2013;63:41–49. doi: 10.1016/j.ymeth.2013.06.027. [DOI] [PMC free article] [PubMed] [Google Scholar]
- 48.Martin M. Cutadapt removes adapter sequences from high-throughput sequencing reads. EMBnet J. 2011;17:3. doi: 10.14806/ej.17.1.200. [DOI] [Google Scholar]
- 49.Gordon A. FASTX-toolkit: FASTQ/A Short-Reads Pre-processing Tools. 2014. http://hannonlab.cshl.edu/fastx_toolkit/
- 50.Speir M.L., Zweig A.S., Rosenbloom K.R., Raney B.J., Paten B., Nejad P., Lee B.T., Learned K., Karolchik D., Hinrichs A.S., et al. The UCSC Genome Browser database: 2016 update. Nucleic Acids Res. 2016;44:D717–D725. doi: 10.1093/nar/gkv1275. [DOI] [PMC free article] [PubMed] [Google Scholar]
- 51.Langmead B., Trapnell C., Pop M., Salzberg S.L. Ultrafast and memory-efficient alignment of short DNA sequences to the human genome. Genome Biol. 2009;10:R25. doi: 10.1186/gb-2009-10-3-r25. [DOI] [PMC free article] [PubMed] [Google Scholar]
- 52.Kozomara A., Birgaoanu M., Griffiths-Jones S. miRBase: from microRNA sequences to function. Nucleic Acids Res. 2019;47:D155–D162. doi: 10.1093/nar/gky1141. [DOI] [PMC free article] [PubMed] [Google Scholar]
- 53.Pantano L., Estivill X., Martí E. A non-biased framework for the annotation and classification of the non-miRNA small RNA transcriptome. Bioinformatics. 2011;27:3202–3203. doi: 10.1093/bioinformatics/btr527. [DOI] [PubMed] [Google Scholar]
- 54.Pantano L., Estivill X., Martí E. SeqBuster, a bioinformatic tool for the processing and analysis of small RNAs datasets, reveals ubiquitous miRNA modifications in human embryonic cells. Nucleic Acids Res. 2010;38:e34. doi: 10.1093/nar/gkp1127. [DOI] [PMC free article] [PubMed] [Google Scholar]
- 55.Team R.C. R: A Language and Environment for Statistical Computing. 2020. https://www.r-project.org/
- 56.Love M.I., Huber W., Anders S. Moderated estimation of fold change and dispersion for RNA-seq data with DESeq2. Genome Biol. 2014;15:550. doi: 10.1186/s13059-014-0550-8. [DOI] [PMC free article] [PubMed] [Google Scholar]
- 57.Gentleman R.C., Carey V.J., Bates D.M., Bolstad B., Dettling M., Dudoit S., Ellis B., Gautier L., Ge Y., Gentry J., et al. Bioconductor: open software development for computational biology and bioinformatics. Genome Biol. 2004;5:R80. doi: 10.1186/gb-2004-5-10-r80. [DOI] [PMC free article] [PubMed] [Google Scholar]
- 58.Wickham H. ggplot2: Elegant Graphics for Data Analysis. Springer International Publishing; 2016. Data Analysis; pp. 189–201. [DOI] [Google Scholar]
- 59.Kolde R. Pheatmap: pretty heatmaps. R package version. 2012;1:726. [Google Scholar]
- 60.Neuwirth E. RColorBrewer: ColorBrewer Palettes. 2014. https://CRAN.R-project.org/package=RColorBrewer
- 61.Patil I. Visualizations with statistical details: The 'ggstatsplot' approach. J. Open Source Softw. 2021;6:3167. doi: 10.21105/joss.03167. [DOI] [Google Scholar]
- 62.Reid J.F. 2013. miRBase: The microRNA Database. R Package Version 1.2.0. [Google Scholar]
- 63.Li J., Han X., Wan Y., Zhang S., Zhao Y., Fan R., Cui Q., Zhou Y. TAM 2.0: tool for MicroRNA set analysis. Nucleic Acids Res. 2018;46:180–185. doi: 10.1093/nar/gky509. [DOI] [PMC free article] [PubMed] [Google Scholar]
Associated Data
This section collects any data citations, data availability statements, or supplementary materials included in this article.
Supplementary Materials
Data Availability Statement
-
•
Bulk miRNA sequencing data have been deposited at GEO and are publicly available as of the date of publication. Accession numbers are listed in the key resources table. Individual data points from qPCR analysis have been deposited at Mendeley and are publicly available as of the date of publication. The DOI is listed in the key resources table.
-
•
This paper does not report original code.
-
•
Any additional information required to reanalyze the data deposited in this paper is available from the lead contact upon request.