
Figure 5.
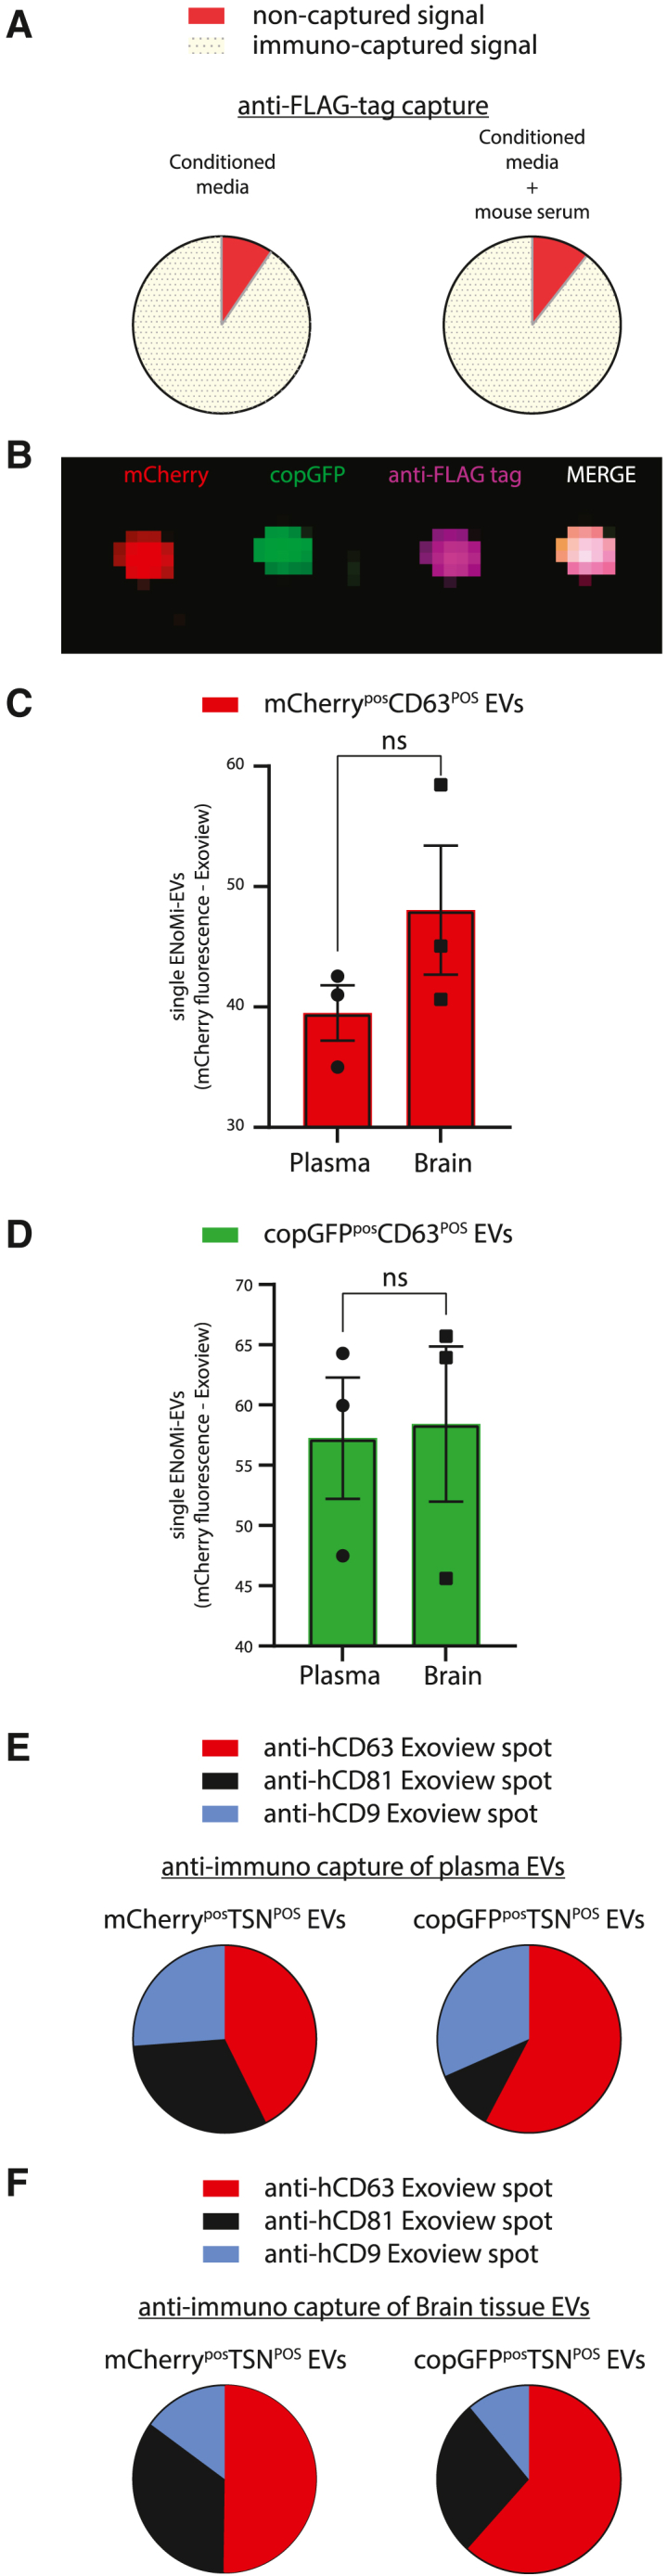
Single-EV characterization of ENoMi-EVs isolated from brain tissue or plasma secreted by mouse brain-implanted ENoMi-transduced human neural progenitor cells on day 21 post-implantation
(A) Tethering of ENoMi-EVs from conditioned media to FLAG tag affinity beads. NanoLuc luminescence was measured on magnetic anti-FLAG beads (yellow, 90.5%) and the suspension containing the remaining non-captured EVs (red) (left). The efficacy of the pulldown of ENoMi-EVs by anti-FLAG-tag affinity beads (yellow, 89.4%) in the presence of mouse plasma was tested with NanoLuc luminescence measurements (right). Mouse plasma did not influence the immunocapture of ENoMi-EVs from conditioned media. (B) Colocalization of ENoMi-fluorophores on anti-CD63 spot of ExoView. Representative image of anti-CD63 spot obtained from analysis of brain-derived EVs by ExoView. mCherry (red), copGFP (green), FLAG tag antibody (purple), Merge (pink). (C) Plasma and brain tissue contain ENoMi-EVs. Mice were implanted with ENoMi-expressing hNPCs, ENoMi-EVs were isolated with SEC to analyze red fluorescence-ENoMi with ExoView. On anti-CD63 spots, mCherry-positive EVs were detected in both brain tissue digests and plasma from xerograph mice. Data represent absolute numbers of mCherry-positive EVs attached to individual CD63 antibodies. (D) Plasma and brain contain copGFP-EVs. Similar to (C), green fluorescent-positive EVs derived from the hNPCs xenograft were detected in CD63 EVs derived from brain and plasma of mice. Data represent absolute numbers of copGFP-positive EVs attached to individual CD63 antibodies. Data were analyzed with an unpaired t test. (E) Tetraspanin (TSN) analysis of plasma ENoMi-EVs. Distribution of TSNs of mCherry (left) or copGFP (right) positive EVs in plasma of mice with an ENoMi-expressing hNPC implant. The majority of mCherry and copGFP-positive plasma EVs were detected in anti-CD63 spots of the ExoView chip. Data represent absolute numbers of EVs attached to individual anti-CD63 (red), -CD81 (black), and -CD9 (blue) and are normalized to 100%. (F) TSN analysis of brain-tissue-derived ENoMi-EVs. Similar to (E), mCherry-positive EVs (left) and copGFP-positive EVs (right) were analyzed with ExoView on anti-CD63, anti-CD81, and anti-CD9 tethered spots. Data represent absolute numbers of brain EVs attached to individual anti-CD63 (red), -CD81 (black), and -CD9 (blue) and are normalized to 100%. ExoView data of (B)–(F) were generated with n = 3.