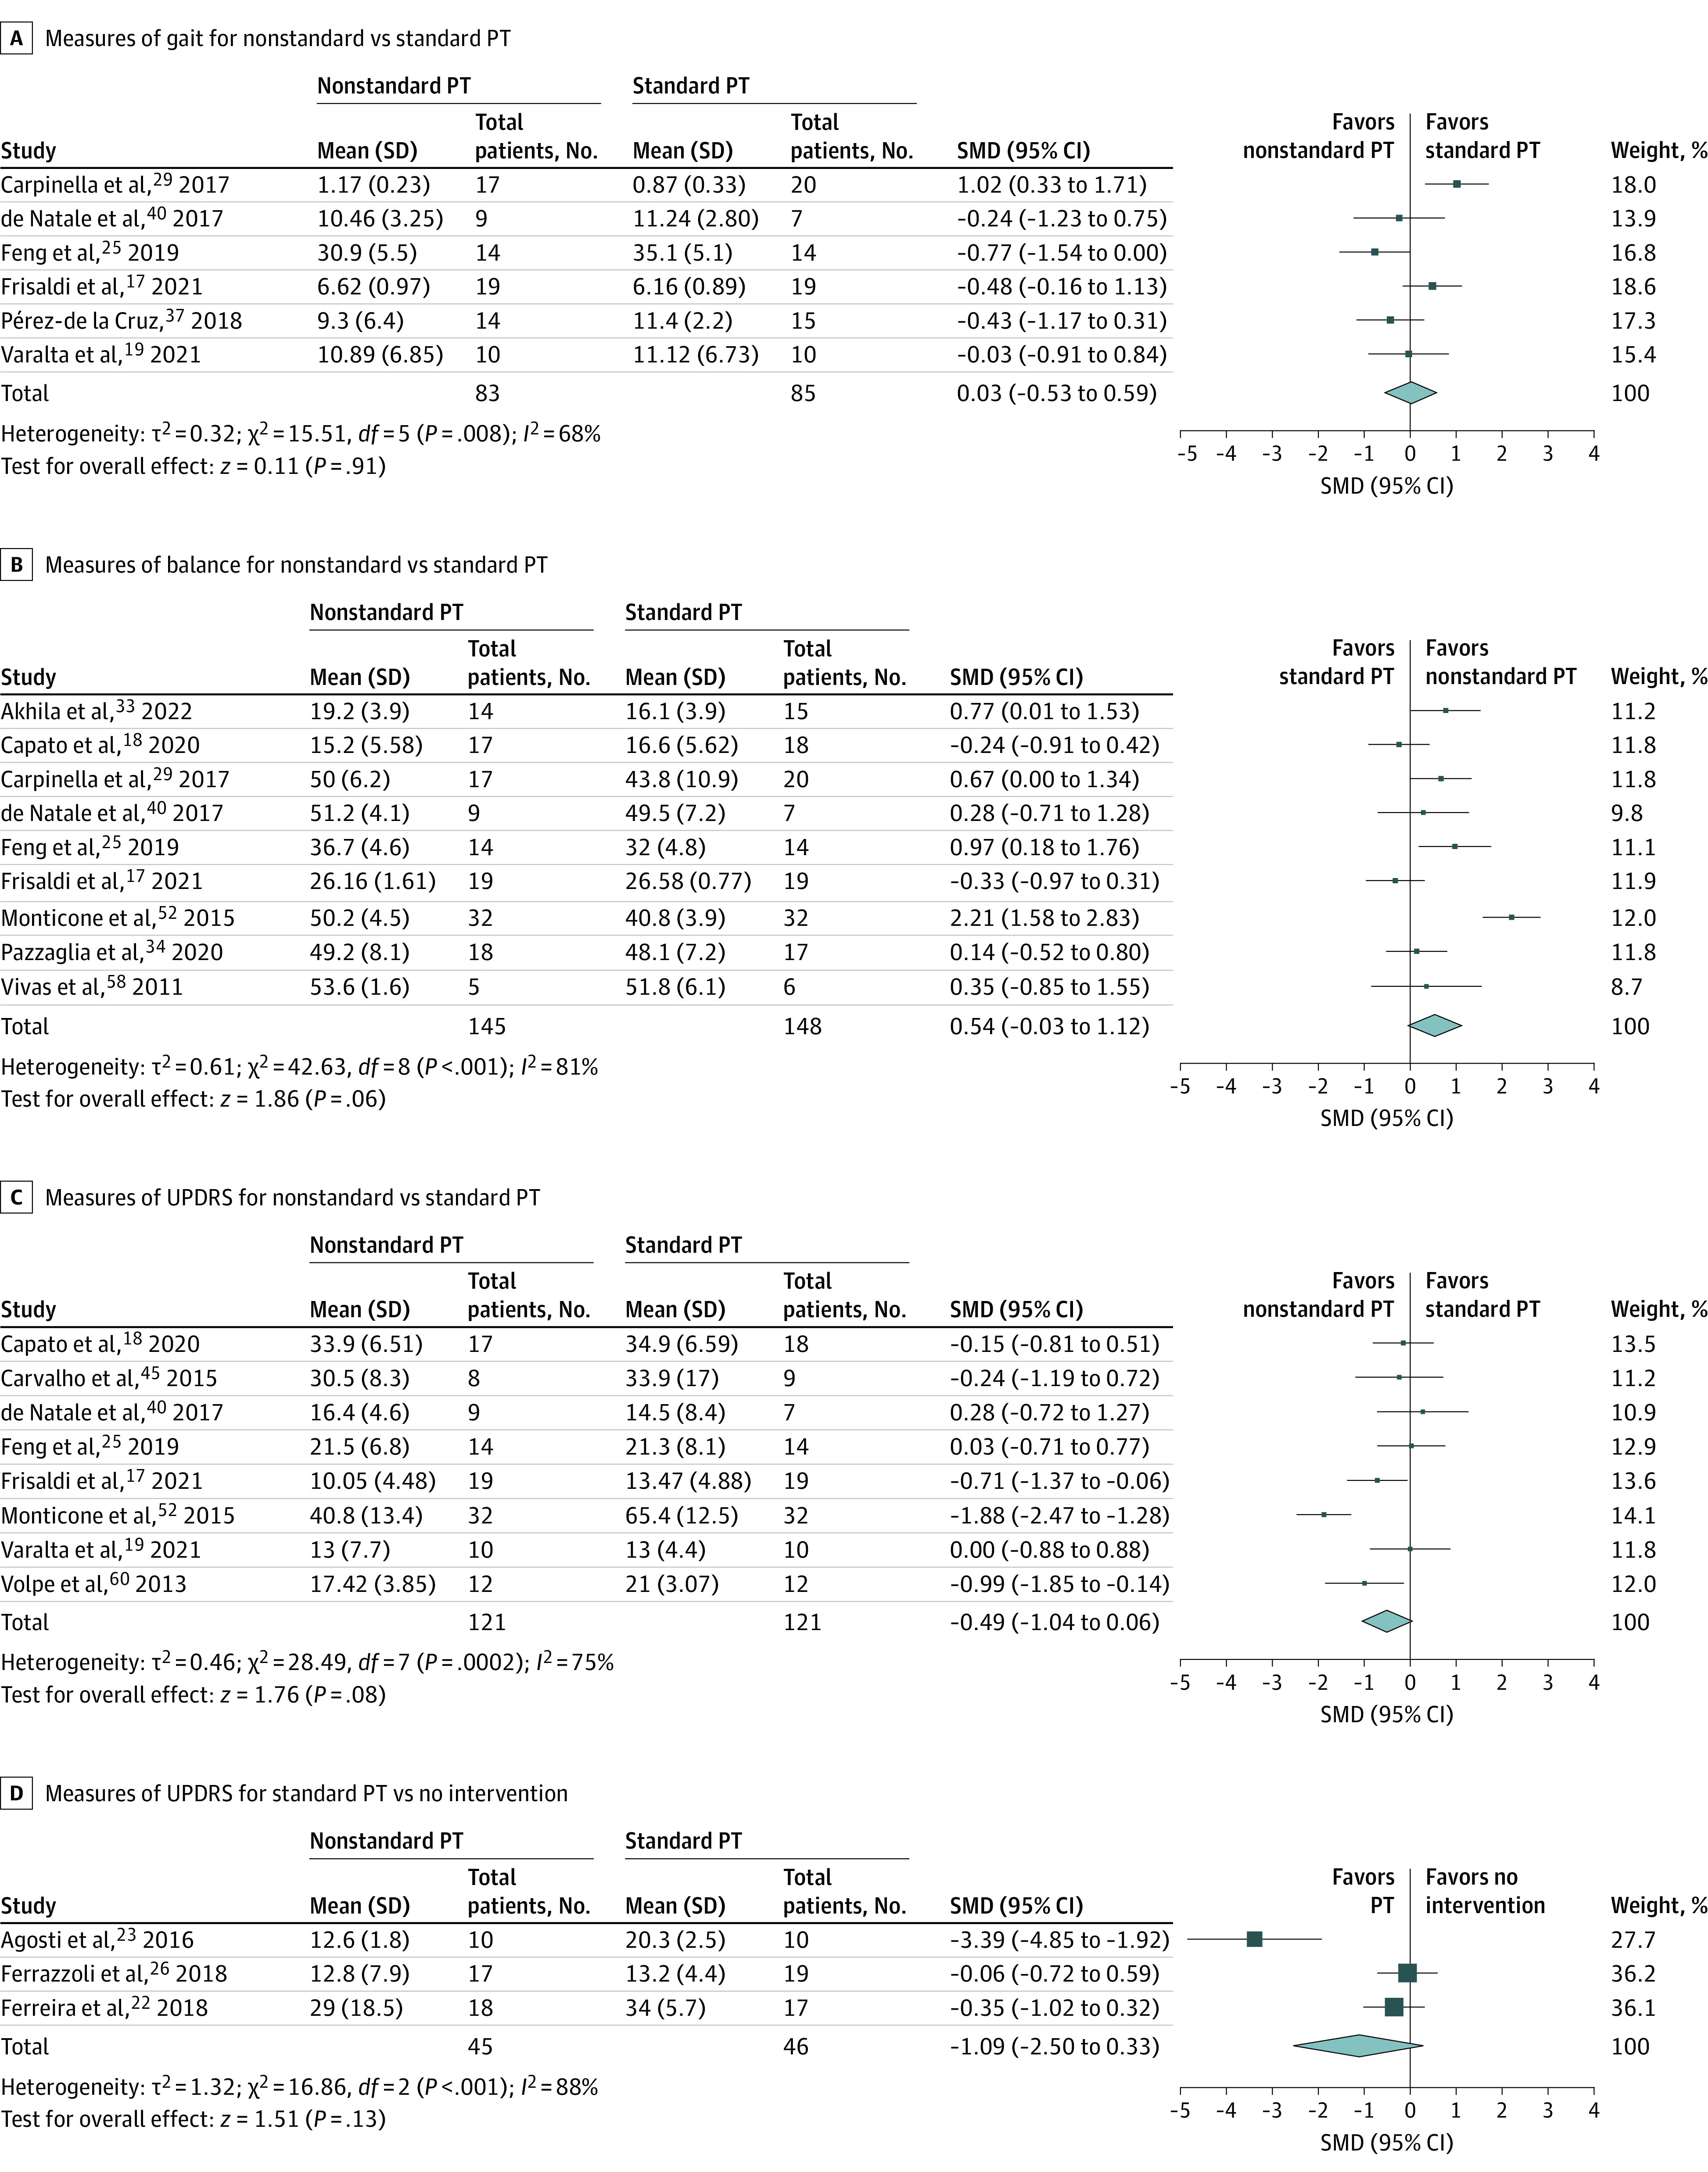
Figure 2. Forest Plots of Measures of Gait, Balance, and Unified Parkinson Disease Rating Scale (UPDRS) Scores.

Gait was assessed by the 10-m walk test and timed up and go test and balance by the Berg Balance Scale and Mini Balance Evaluation System Test. A random-effects model was used with inverse variance. Squares represent standardized mean differences (SMDs), with horizontal lines representing 95% CIs. Diamonds represent pooled SMDs, with outer points of the diamonds representing 95% CIs. PT indicates physical therapy.
