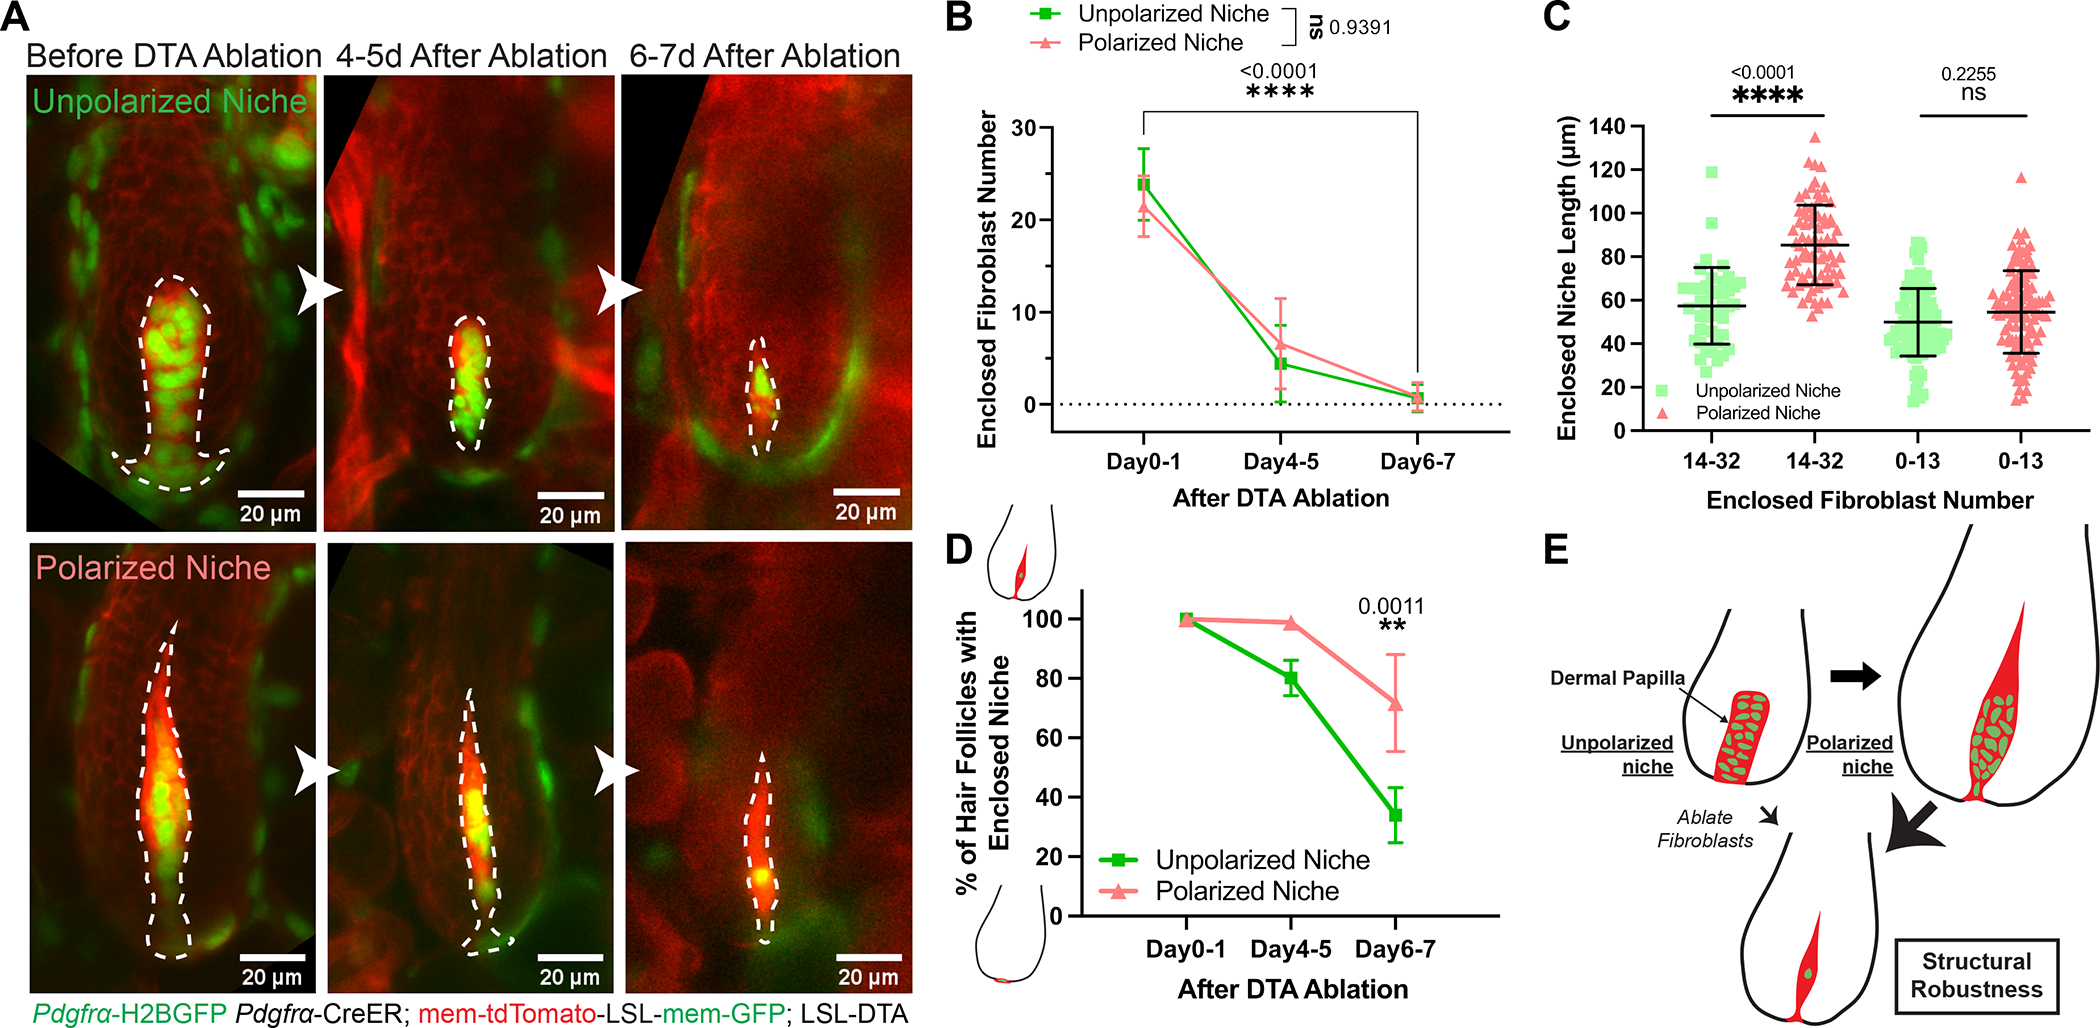
Figure 2. Polarized niche confers a structurally robust architecture despite the loss of its constituent cells.

A. The same unpolarized and polarized dermal papillae (DPs, dash-lined) longitudinally imaged before and after diphtheria toxin (DTA) induced fibroblast ablation. Ablation is achieved by tamoxifen activated Cre in fibroblasts (Pdgfrα-CreER) and LSL-DTA. Fibroblast nuclei are labeled in green (Pdgfrα-H2BGFP) and cell membranes are in red (membrane-tdTomato).
B. The number of fibroblasts that remain enclosed within the hair follicle (HF) epithelium after DTA-induced fibroblast ablation. Fibroblast number is counted based on green fibroblast nuclear signal labeled by Pdgfrα-H2BGFP. For unpolarized DPs at mid-growth, n=41 (Day0–1), 53 (Day4–5), and 60 (Day6–7) from 3 mice; for polarized DPs at late-growth, n=72 (Day0–1), 78 (Day4–5), and 71 (Day6–7) from 3 mice.
C. Length of entire DPs that remain enclosed after ablation. Based on the reported critical threshold of DP fibroblast number,11 we classified DP as either with abundant (14 to 32) or few (0 to 13) enclosed fibroblasts. For unpolarized DPs, n=42 HFs (14–32 fibroblasts) and 99 HFs (0–13 fibroblasts) from 3 mice; For polarized DPs, n=77 HFs (14–32 fibroblasts) and 110 HFs (0–13 fibroblasts) from 3 mice.
D. Percentage of HFs that remain enclosed DPs after fibroblast ablation. For HFs with unpolarized DPs, n=3 mice (68 HFs at Day0–1, 68 HFs at Day4–5, and 66 HFs at Day6–7); for HFs with polarized DPs, n=3 mice (102 HFs at Day0–1, 108 HFs at Day4–5, and 89 HFs at Day6–7).
E. Schematic of forming a polarized DP niche architecture that is structurally more robust even after fibroblast ablation. Green indicates DP fibroblast nuclei and red indicates their membranes.
All data are presented as mean ± S.D. Mixed-effects analysis is used in Fig.2B. Tukey’s multiple comparisons test is used in Fig.2C, D. See also Figure S1.
