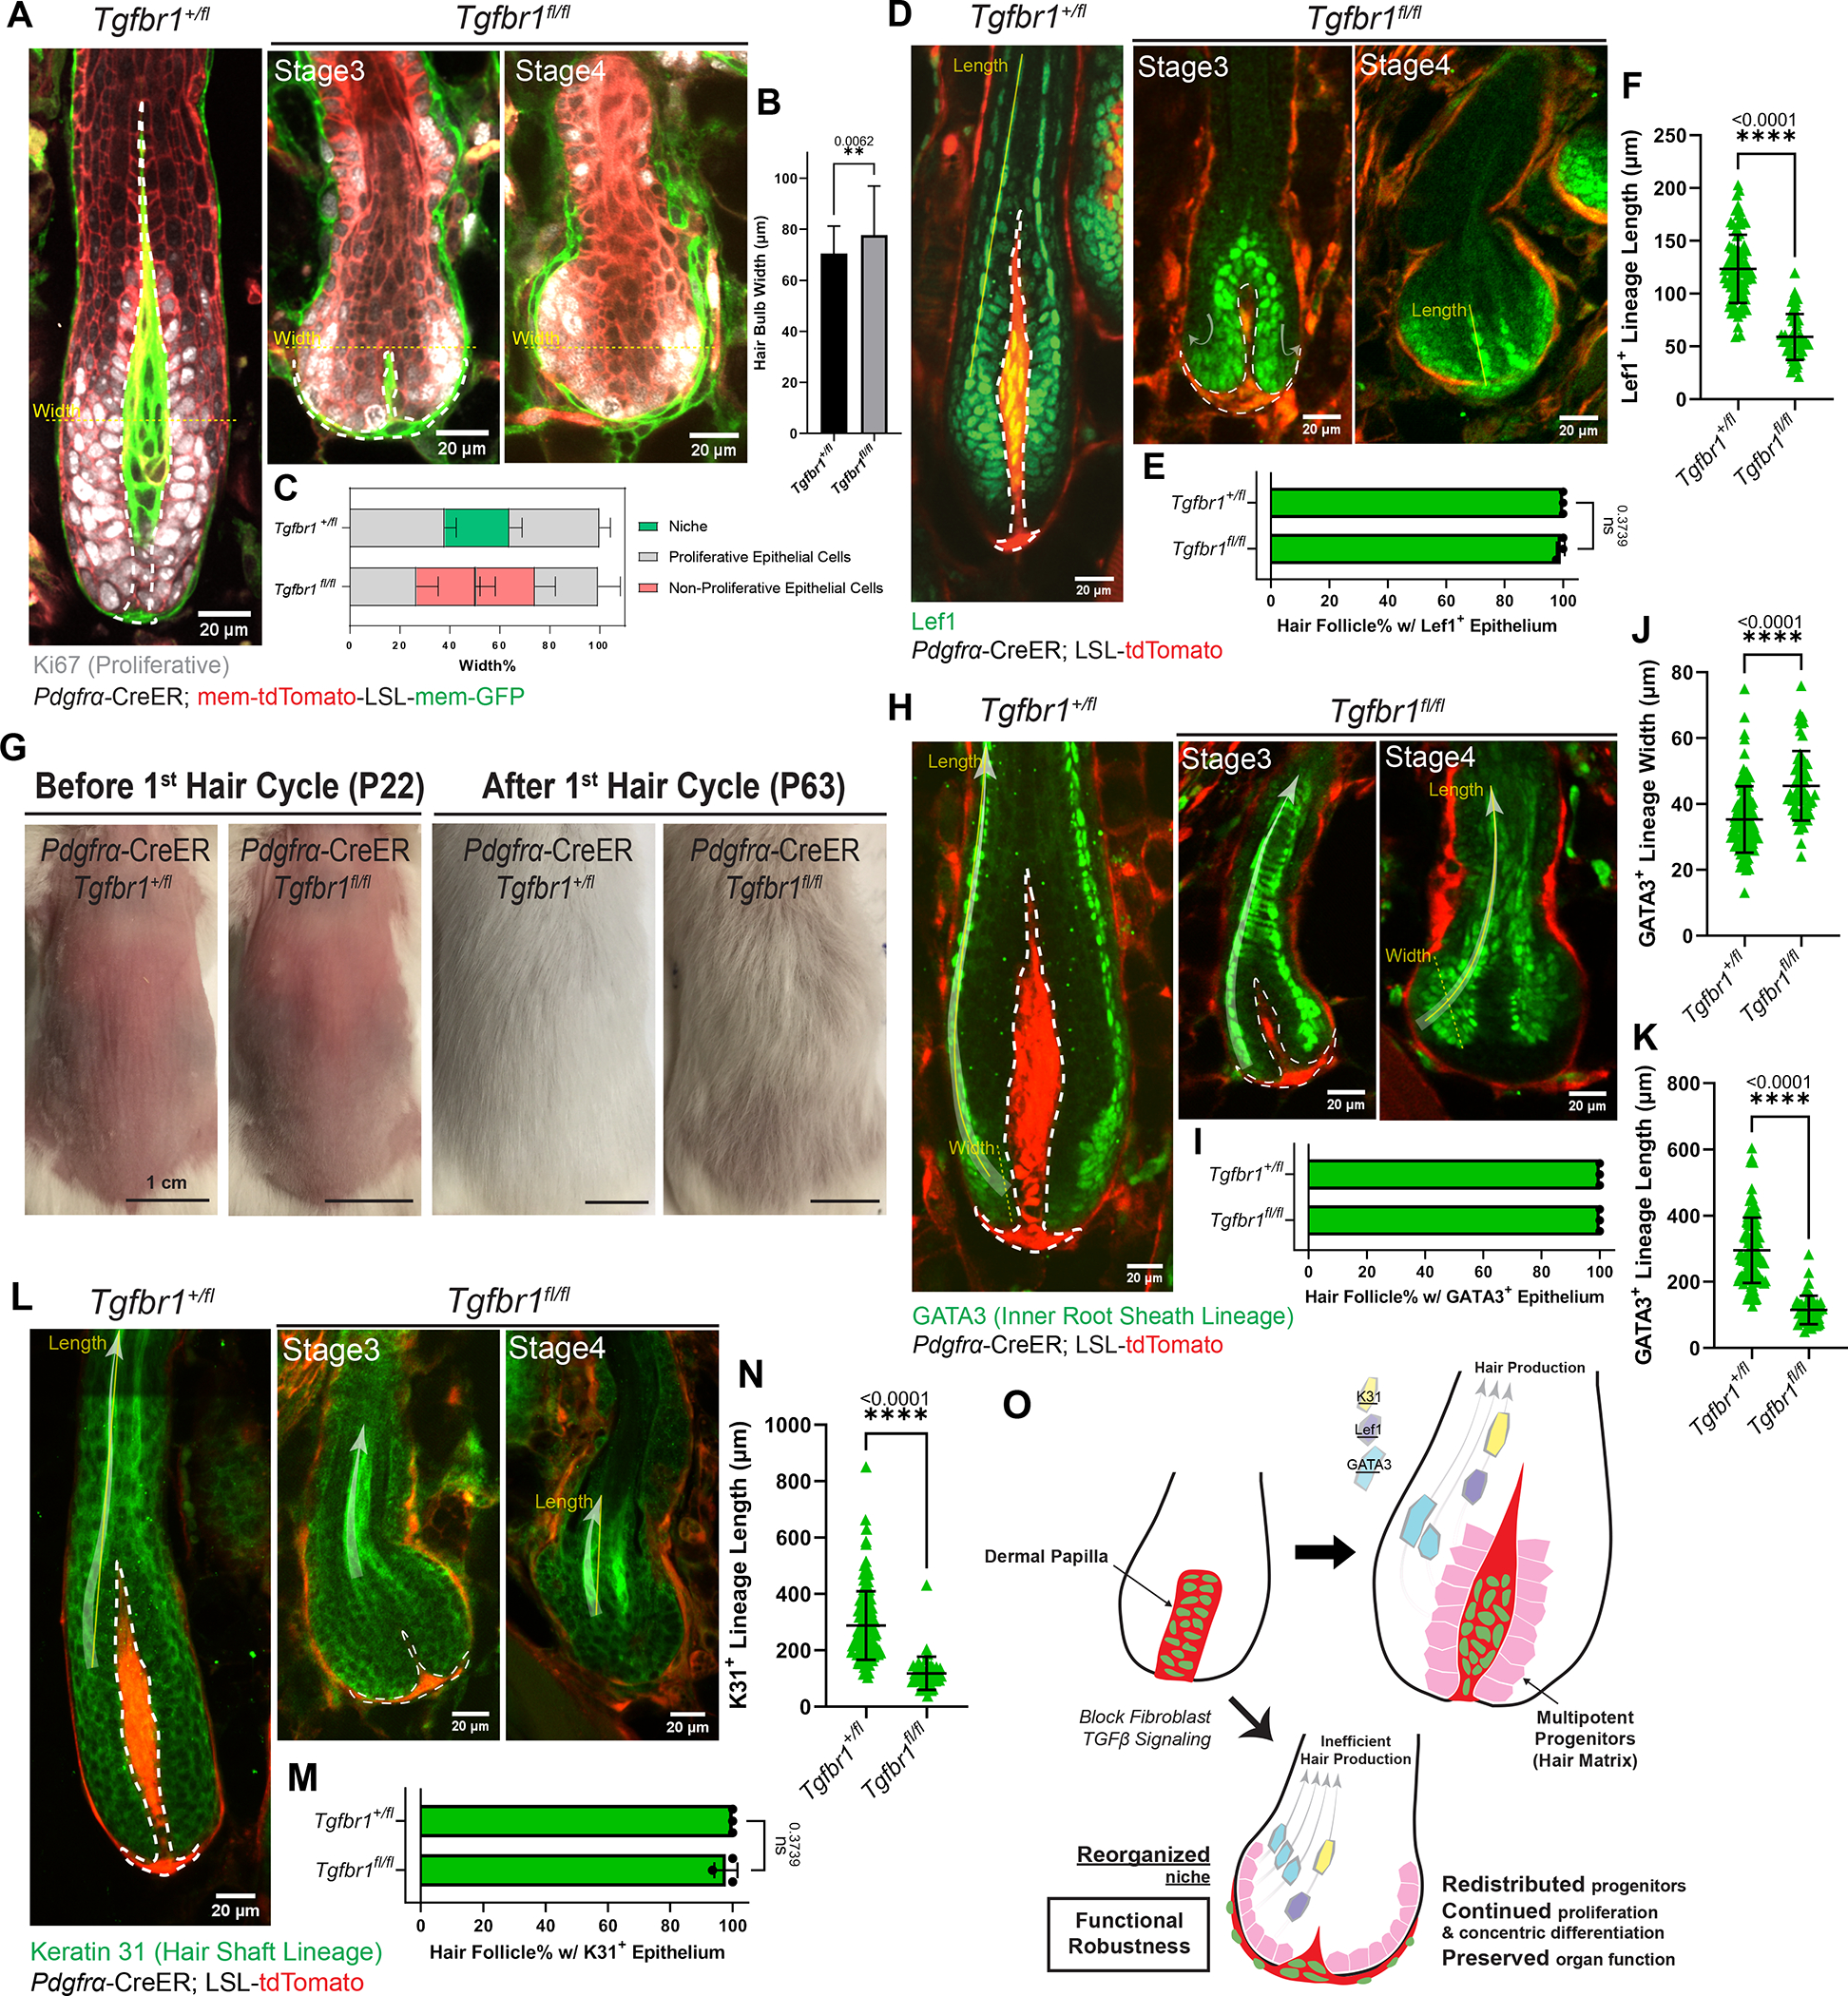
Figure 4. Reorganized niche induces redistribution of multipotent progenitors but largely supports their function.

A. Immunostaining for Ki67 (gray) in ear skin whole mounts to detect proliferative epithelial cells in hair follicles (HFs) at different stages. Fibroblast membranes are in green (Pdgfrα-CreER; membrane-GFP) and other membranes are in red (membrane-tdTomato).
B. Hair bulb maximal width in Tgfbr1+/fl and Tgfbr1fl/fl at yellow dash-line locations in Fig.4A. n=75 HFs from three Tgfbr1+/fl mice, n=62 HFs from three Tgfbr1fl/fl mice.
C. Spatial distribution of cell populations (niche, proliferative epithelial cells, non-proliferative epithelial cells) in the bulb region, measured as the width percentage of each population at maximal hair bulb width (yellow dash-lines in Fig.4A). n=75 HFs from three Tgfbr1+/fl mice, n=62 HFs from three Tgfbr1fl/fl mice.
D. Immunostaining for Lef1 (green) in thick back skin sections to detect multipotent progenitors and Wnt/β-catenin signaling at different stages. The redistribution directions are marked by arrows.
E. Percentage of HFs containing Lef1+ epithelial populations in the bulb region. n=3 Tgfbr1+/fl mice (215 late-growth HFs), n=3 Tgfbr1fl/fl mice (93 HFs from stages shown).
F. Length of Lef1+ differentiating lineage along the differentiation routes (yellow solid line in Fig.4D). n=81 late-growth HFs from three Tgfbr1+/fl mice, n=49 Stage4 HFs from three Tgfbr1fl/fl mice.
G. Representative photos of mice with back skin shaved at the quiescent stage, and revisited after an entire first hair cycle. n=3 Tgfbr1+/fl and 3 Tgfbr1fl/fl mice.
H. Immunostaining for GATA3 (green) in thick back skin sections to detect the differentiation of inner root sheath lineages (Cuticle and Huxley’s layer) at different stages. The differentiation routes are marked with arrows.
I. Percentage of HFs containing GATA3+ epithelial populations in concentric organizations. n=3 Tgfbr1+/fl mice (328 late-growth HFs), n=3 Tgfbr1fl/fl mice (103 HFs from stages shown).
J. Width of GATA3+ differentiating lineage at the beginning of differentiation routes (yellow dash line in Fig.4H). n=109 late-growth HFs from three Tgfbr1+/fl mice, n=59 Stage4 HFs from four Tgfbr1fl/fl mice.
K. Length of GATA3+ differentiating lineage along the differentiation routes (yellow solid line in Fig.4H). n=112 late-growth HFs from three Tgfbr1+/fl mice, n=51 Stage4 HFs from four Tgfbr1fl/fl mice.
L. Immunostaining for Keratin 31 (K31, green) in thick back skin sections to detect the differentiation of hair shaft lineage (Cortex) at different stages. The differentiation routes are marked with arrows.
M. Percentage of HFs containing K31+ epithelial populations in concentric organizations. n=3 Tgfbr1+/fl mice (243 late-growth HFs), n=3 Tgfbr1fl/fl mice (109 HFs from stages shown).
N. Length of K31+ differentiating lineage along the differentiation routes (yellow solid line in Fig.4L). n=132 late-growth HFs from three Tgfbr1+/fl mice, n=44 Stage4 HFs from three Tgfbr1fl/fl mice.
O. Schematic illustrating that reorganized niche architecture continues supporting redistributed proliferative multipotent progenitors. However, progenitor differentiation is rerouted and generates shorter lineages for less efficient hair production.
Dermal papillae are dash-lined. In Fig.4D, H, L, fibroblasts are labeled in red by Pdgfrα-CreER; LSL-tdTomato. All data are presented as mean ± S.D. and analyzed with unpaired two-tailed t-test. See also Figure S2, S4.
