
Figure 1. A role for TMEM164 in the regulation of C20:4 ether lipids.
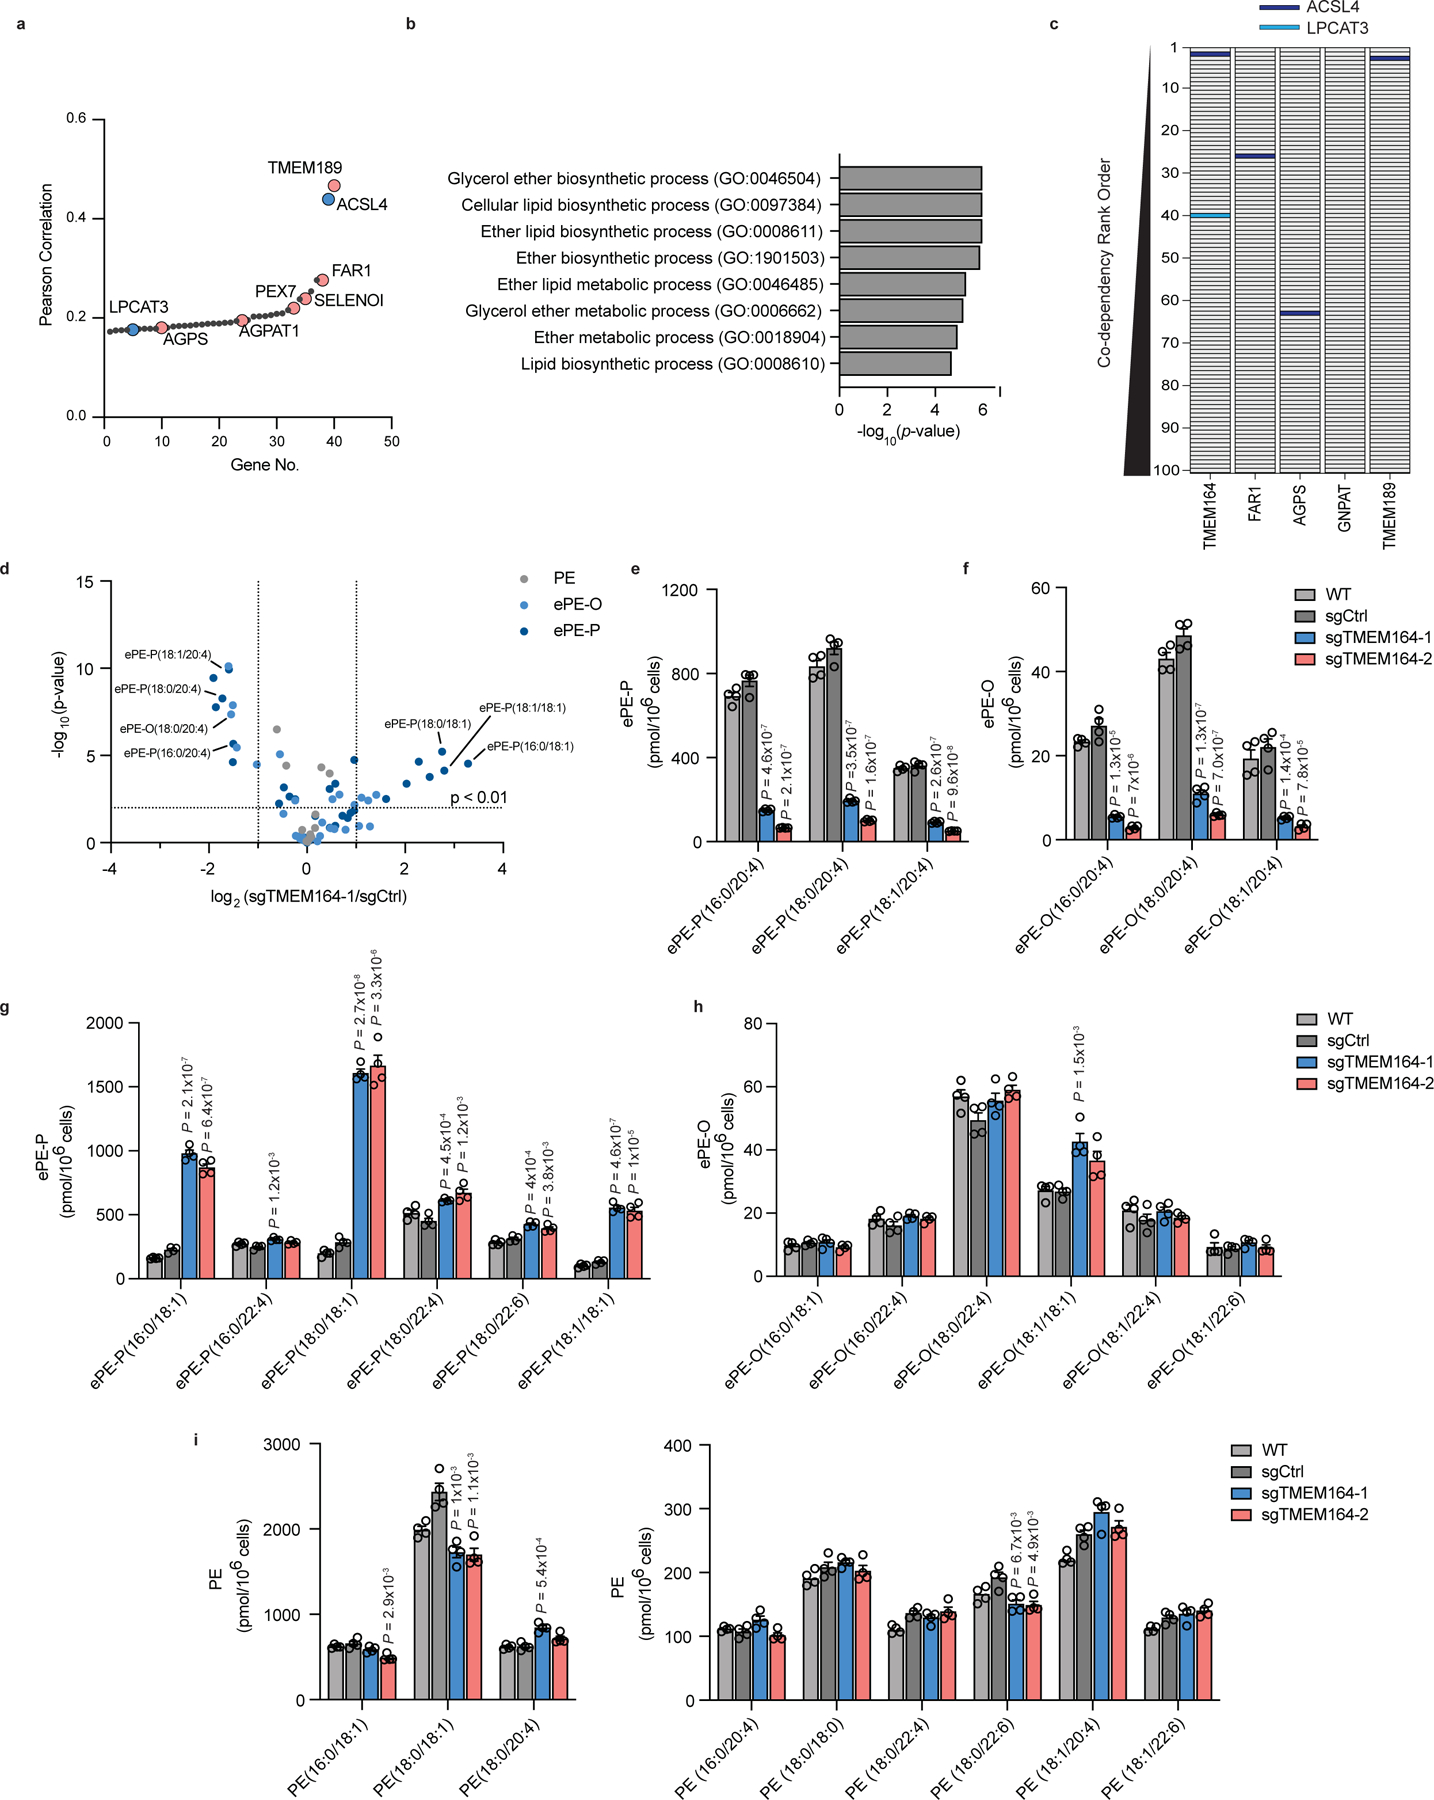
a, Cancer dependency map analysis of TMEM164 showing the genes with the top-40 highest co-dependency scores. Blue and red designate genes involved in C20:4 and ePL metabolism, respectively. b, GO enrichment analysis of the top 40 co-dependency genes with TMEM164. c, Depiction of the location of C20:4 lipid metabolic genes ACSL4 (red) and LPCAT3 (blue) in the relative rank order of the top 100 co-dependencies for TMEM164 versus established ePL-related genes FAR1, AGPS, GNPAT, and TMEM189. Note that LPCAT3 was only found in the top-100 co-dependencies for TMEM164. d, Volcano plot of targeted lipidomic analysis comparing ether PE (ePE) lipids in sgCtrl and sgTMEM164 786-O cells. Data represent mean values from four independent experiments for sgCtrl and sgTMEM164-1 cells. e, f, C20:4 ePE-P (e) and ePE-O (f) lipid measurements in parental (WT), sgCtrl, and sgTMEM164 786-O cells. Two independently generated sgTMEM164 cell populations were analyzed (−1 and −2). g, h, Additional ePE-P (g) and ePE-O (h) lipid measurements in WT, sgCtrl, and sgTMEM164 786-O cells. i, Diacyl PE lipid measurements in WT, sgCtrl, and sgTMEM164 786-O cells. For e-i, data represent mean values ± S.E.M from four independent experiments per group. P-values were derived using a Two-sided Student’s t-test performed relative to sgCtrl cells.