
Extended Data Fig. 5. Integrated homology mapping and AlphaFold2 analysis identifies a predicted shared structure between TMEM164 and the AIG1/ADTRP lipid hydrolases.
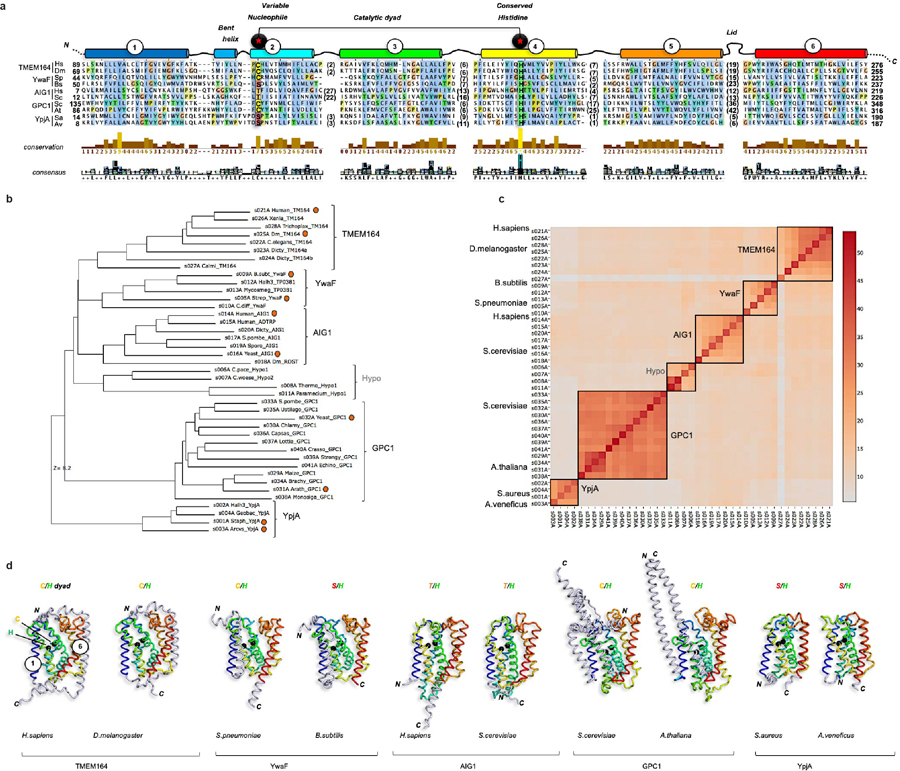
a, Structure-based sequence alignment by DALI of AlphaFold2 models (http://alphafold.ebi.ac.uk) of the H.sapiens (UniProt Q5U3C3) and D.melanogaster (UniProt Q7JRB2) TMEM164 proteins, with representative proteins from the AIG1/ADTRP family (H.sapiens (Q9NVV5); S.cerevisiae (P38842)), prokaryotic YwaF (S.pneumoniae (Q8CYG1); B.subtilis (P25149)) and YpjA proteins (S.aureus (Q2FYH4); A.venificus (F2KNL0)), and GPC1 enzymes (S.cerevisiae (P48236); A.thaliana (Q9FJB4). In some cases, models were built with ColabFold implementation of AlphaFold2 (http://github.com/sokrypton/ColabFold). The alignment was displayed and analyzed with Jalview (http://jalview.org), showing the six blocks of conserved structure corresponding to TM helices 1–6. Length and sequence-variable gaps in the alignment corresponding to loops in the superposed folds were abbreviated by residue stretches in parentheses. Positions of the variable nucleophile and invariant His residues (Cys123 and His181 in human TMEM164, respectively) are boxed and labeled. b, DALI-derived superpositions provide a measure of structural relatedness for the six main branches of the enzyme superfamily displayed in the phylogenetic hypertree in Fig. 4c (http://kinase.com/tools/HyperTree.html), with chains aligned in panel a noted by red circles. Z-score of 8.2 is provided for the most distant branch (YpjA). c, Matrix of DALI Z-scores displaying the clusters of more closely related AlphaFold2-derived structures from all-against-all superpositions performed with the DALI server (http://ekhidna2.biocenter.helsinki.fi), leading to reconstitution of the six branches of the enzyme superfamily. Five of these clusters have sequence alignments that can be retrieved from the PFAM database (http://pfam.xfam.org): TMEM164 (PF14808), AIG1/ADTRP (PF04750), GPC1 (PF10998), YwaF (PF09529) and YpjA (PF7187). d, Tube representations of aligned AlphaFold2 models showing positions of the catalytic dyad with black Ca spheres and preservation of the core 6TM fold (color-ramped from blue TM1 to red TM6) with N-or C-terminal extensions drawn in grey. Figures composed with PyMOL (http://pymol.org).