
Extended Data Fig. 9. C20:4 PE and non-C20:4 ePE-P measurements in TMEM164-deficient RKN and ES-2 cells.
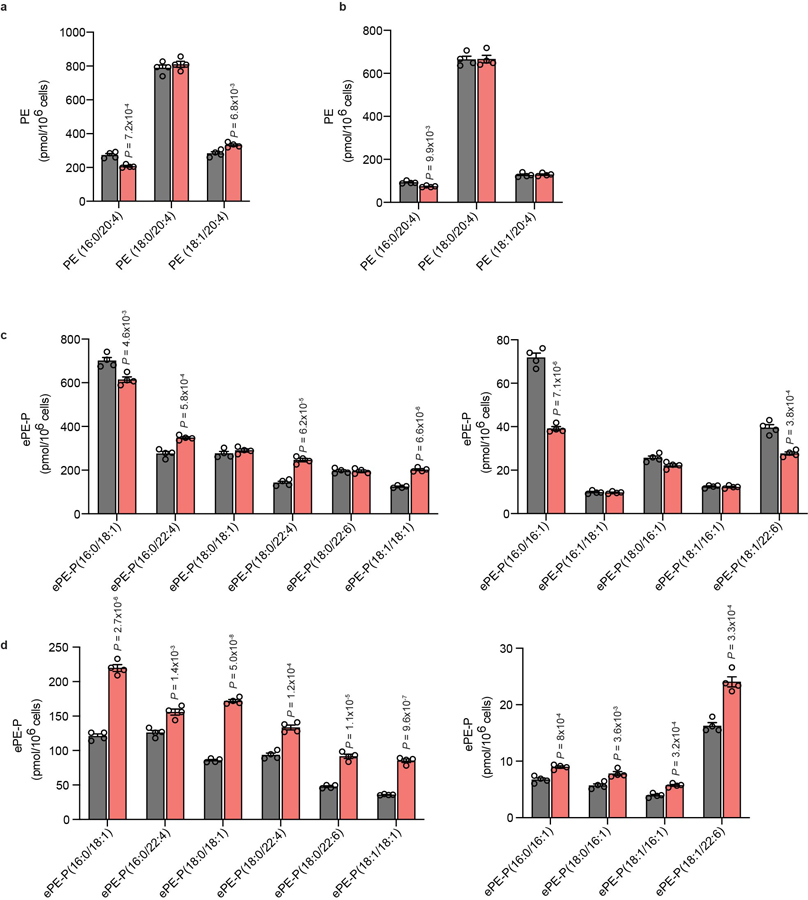
a, b, Measurement of C20:4 PE lipids in sgCtrl and sgTMEM164-2 RKN (a) and ES-2 (b) cell lines. c, d, Measurement of non-C20:4 ePE-P lipids in sgCtrl and sgTMEM164-2 RKN (c) and ES-2 (d) cell lines. Data represent mean values ± S.E.M from four independent experiments per group. P-values were derived using a Two-sided Student’s t-test performed relative to sgCtrl cells.