
Figure 5. Characterization of the enzymatic activity and ferroptosis contributions of TMEM164.
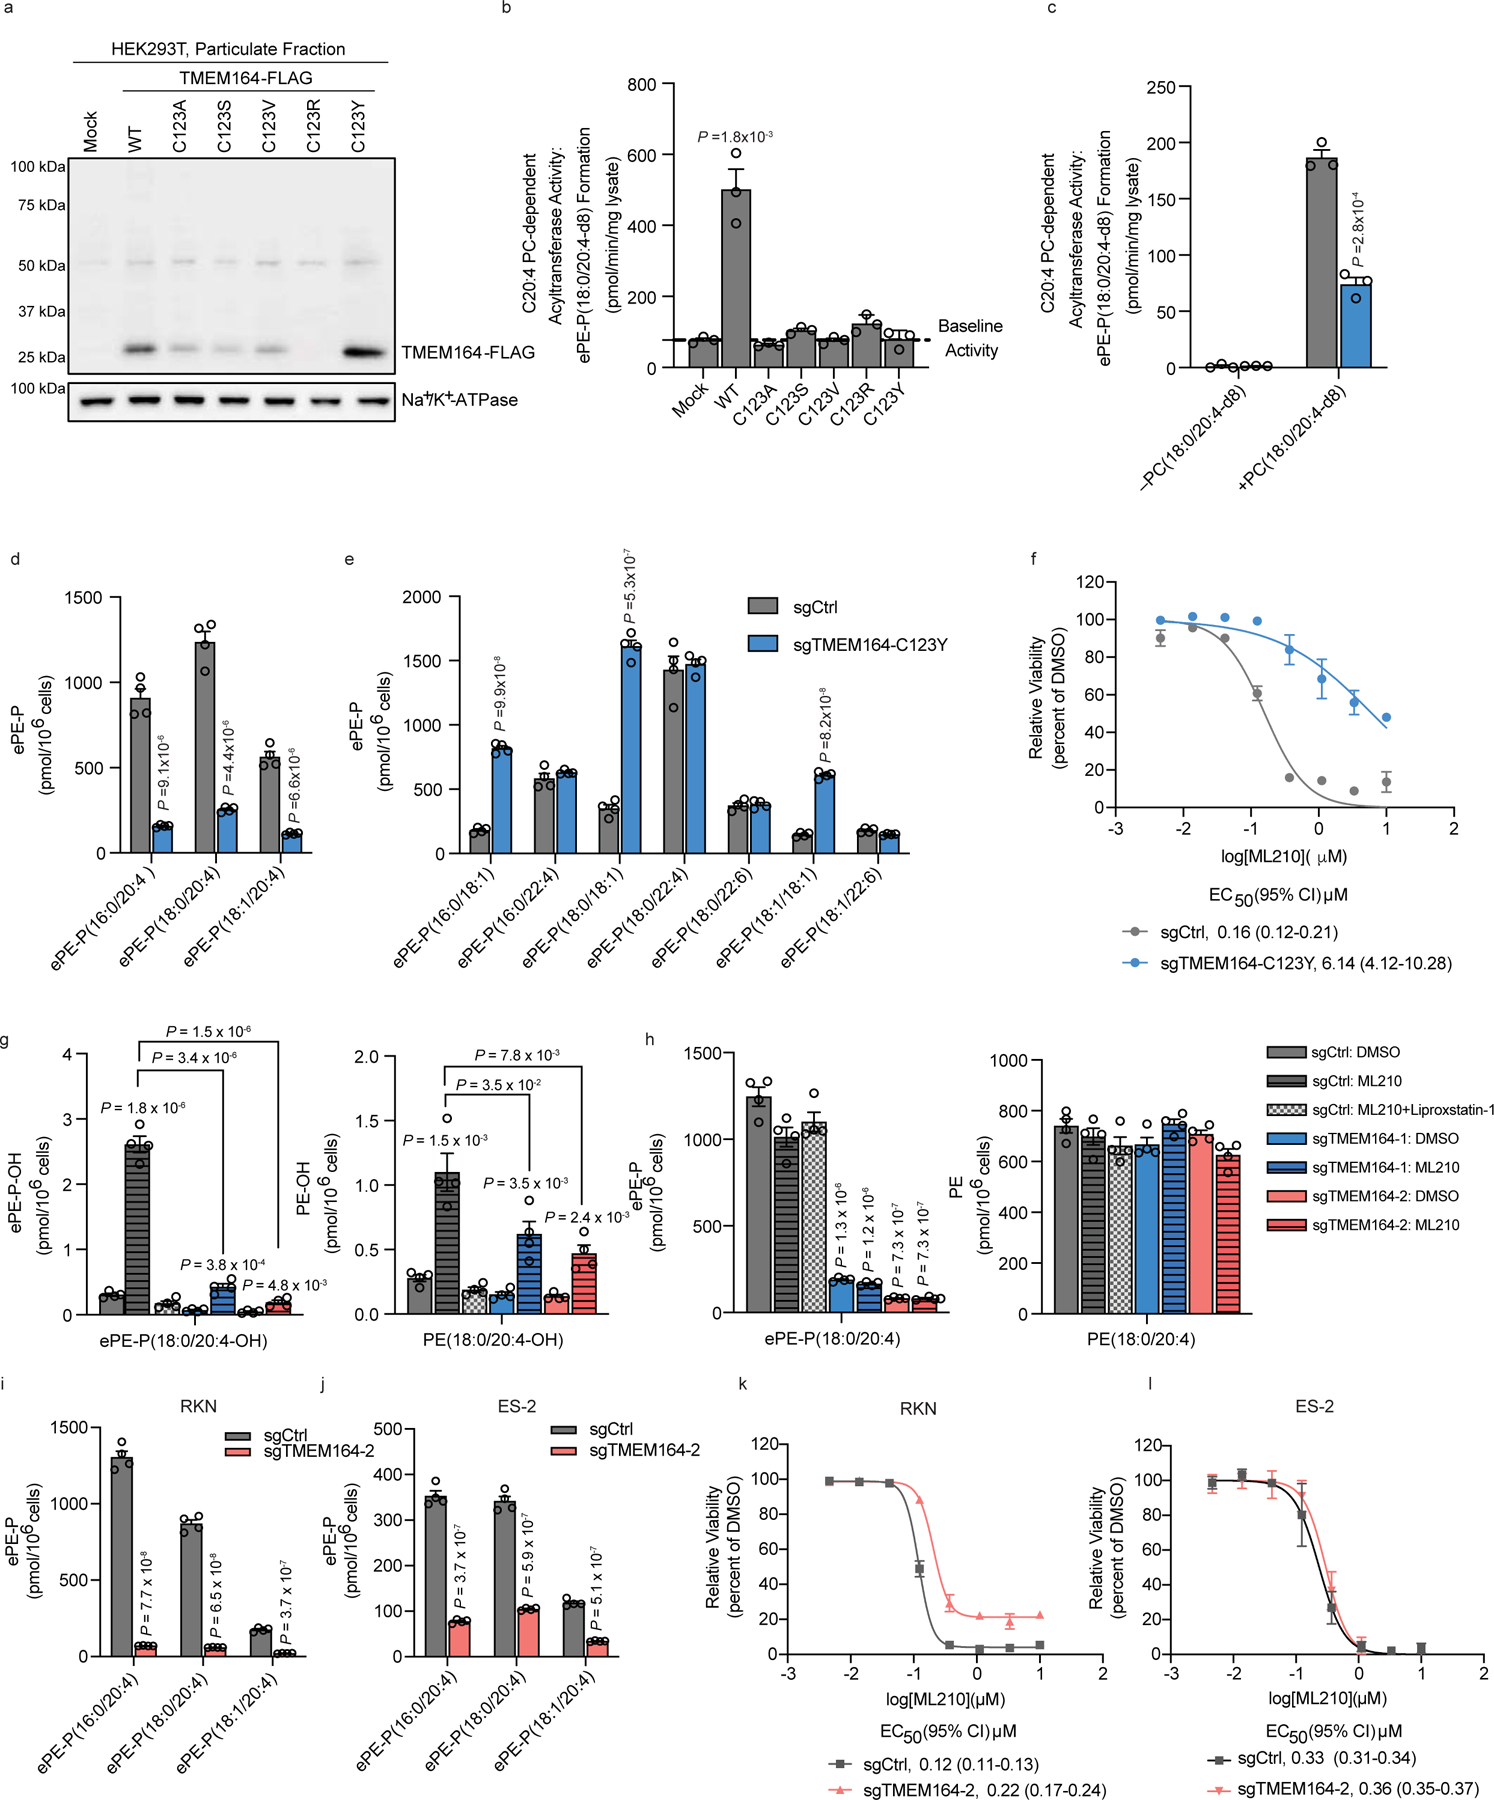
a, Western blot of membrane lysates from HEK293T cells expressing C-terminally FLAG-tagged WT-TMEM164 or C123X-TMEM164 mutants. b, c, Measurement of the formation of ePE-P(C18:0/C20:4-d8) from diacyl PC(C18:0/C20:4-d8) (50 µM) and lyso-e-PE-P(C18:0) (50 µM) as substrates assayed with membrane lysates (1 µg/uL, 1 h incubation at 37° C) from (b) HEK293T cells expressing the indicated TMEM164 proteins or (c) sgCtrl and sgTMEM164-C123Y based-edited 786-O cell populations. d, e, Measurement of C20:4 ePE-P (d) and additional ePE-P (e) lipids in sgCtrl and sgTMEM164-C123Y base-edited 786-O cell populations. f, Viability of sgCtrl and sgTMEM164-C123Y base-edited 786-O cell populations treated with the indicated concentrations of ML210 measured at 24 h post-treatment. g, h, Oxidized (g) and non-oxidized (h) PE(C18:0/C20:4) and ePE-P(C18:0/2C0:4) lipid measurements in sgCtrl and sgTMEM164 786-O cells treated with ML210 for 2 h. sgCtrl: ML210 + Liproxstatin-1 group was pre-treated with the ferroptosis-blocking compound Liproxstatin-1 (0.5 µM) for 2 h prior to ML210 treatment. i, j, C20:4 ePE lipid measurements in sgCtrl and sgTMEM164 RKN (i) and ES-2 (j) cell lines. k,l, Viability of sgCtrl and sgTMEM164 RKN (k) and ES-2 (l) treated with indicated concentration of ML210 measured at 24 h post-treatment. For b and c data represent mean values ± S.E.M from three independent experiments per group. For d-e and g-j, data represent mean values ± S.E.M from four independent experiments per group. *p< 0.01, ** p < 0.001 (Two-sided Student’s t-test performed relative to sgCtrl cells). For f, k and l, data represent mean values ± S.E.M. from two independent experiments. For b,c, d-e and g-j P-values were derived using a Two-sided Student’s t-test performed relative to sgCtrl cells.