
Extended Data Fig. 2. Targeted lipidomic (LC-MS/MS) methods for measuring ePLs.
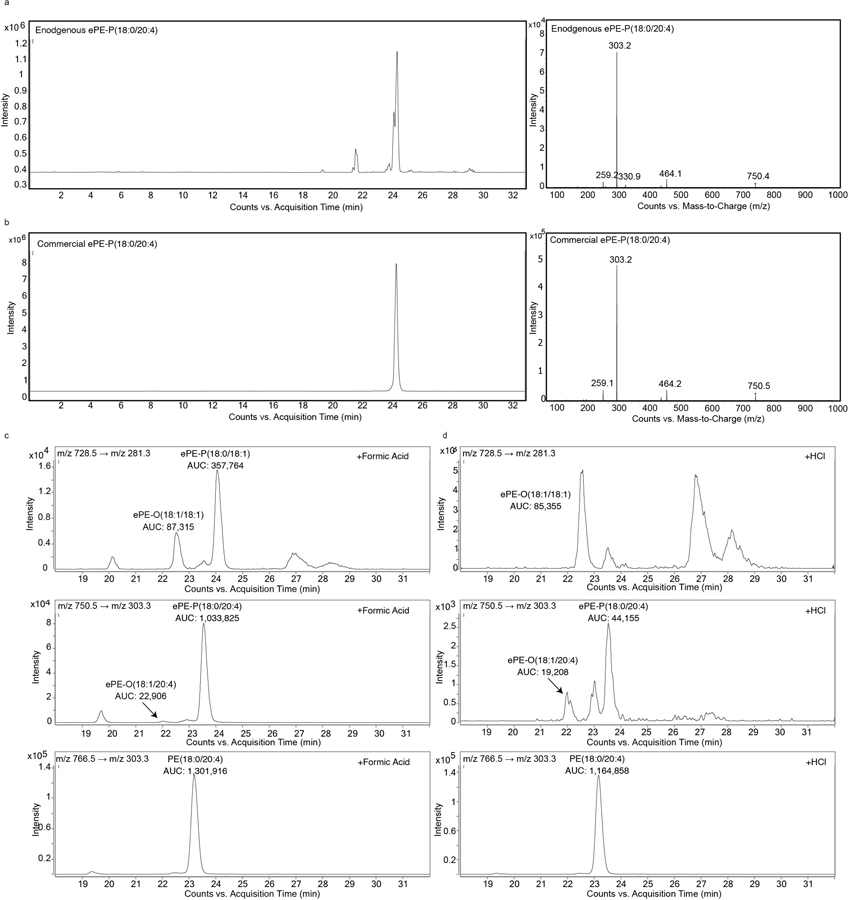
a, b, Detection of endogenous ePE-P(C18:0/C20:4) in 786-O cells by LC-MS/MS (a) and comparison to commercial ePE-P(C18:0/C20:4) standard (b). Left traces show extracted ion chromatogram of a feature corresponding to ePE-P(C18:0/C20:4) (750.5 → 303.3). Right traces show MS2 spectra for ePE-P(C18:0/C20:4). c,d, Targeted LC-MS/MS analysis of isobaric ePE-O and ePE-P species performed as described in the Methods section revealing that they are separated by approximately 1.5 min difference in retention time. Treatment of lipid extracts from 786-O cells with 10% (v/v) formic acid (c) or HCl (3N) (d) for 30 min at 37°C reveals ePE-P elutes after ePE-O as evidenced by a significant reduction in the ePE-P peak following HCl treatment. AUC, area under the curve.