
Extended Data Fig. 3. Alterations in ePC and diacyl PC production in TMEM164-deficient cells.
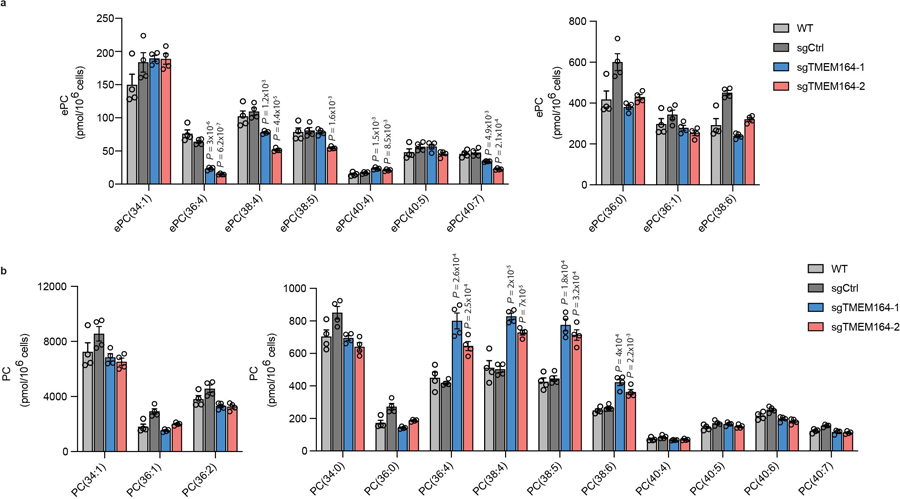
a, b ePC (a) and PC (b) lipid measurements in sgCtrl and sgTMEM164 786-O cells. For a, due to technical limitations we did not distinguish between ePC-O and ePC-P lipids. Data represent mean values ± S.E.M from four independent experiments per group. P-values were derived using a Two-sided Student’s t-test performed relative to sgCtrl cells; only shown for lipids where sgCtrl and parental (WT) data did not differ.