Fig. 4.
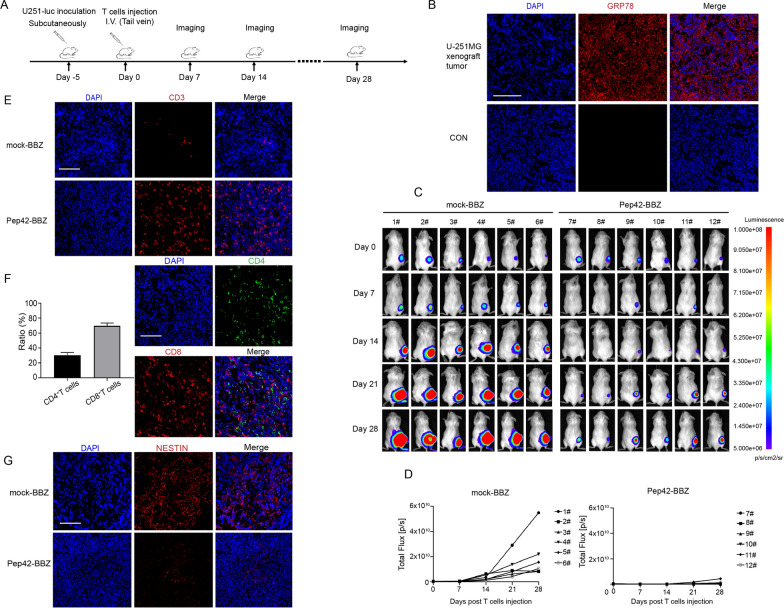
Pep42-BBZ CAR-T cells showed antitumor activity in vivo. A Schematic in the top panel illustrates the experiment design for the U-251MG xenograft tumors. NCG mice was inoculated subcutaneously with 5 × 10⁶ luciferase-expressing U-251MG cells. Five days later mock-BBZ and Pep42-BBZ CAR-T cells (1 × 10⁷ per mouse) were injected intravenously into tail veins. The tumors growth was monitored once a week. B A representative image of csGRP78 staining of xenograft tumor sections by IF. Five days after tumor cells inoculation, tumor tissues were extracted and cell surface IF was performed for GRP78. Control was stained without GRP78 antibody. C The tumor bioluminescence images by IVIS imaging. D Tumor bioluminescence intensity curves for the two groups. E Representative CD3 staining of tumor sections by IF. Five-days post injection, 3 tumors from each group were extracted, embedded in paraffin, sectioned, and stained with CD3ζ antibody coupled with Cy3-conjunctated secondary antibodies. Two representative images are included from each group. F The statistics and representatives of CD4 and CD8 staining on Pep42-BBZ CAR-T treated tumor sample sections. The numbers of FITC labeled-CD4 and Cy3 labeled-CD8 were calculated and performed for percentage counting. G Representative NESTIN staining of tumor sections by IF. Five-days post injection, 3 tumors from each group were extracted, embedded in paraffin, sectioned, and stained with NESTIN antibodies coupled with Cy3-conjunctated secondary antibodies. Two representative images from each group are shown. Scale bar = 100 μm

