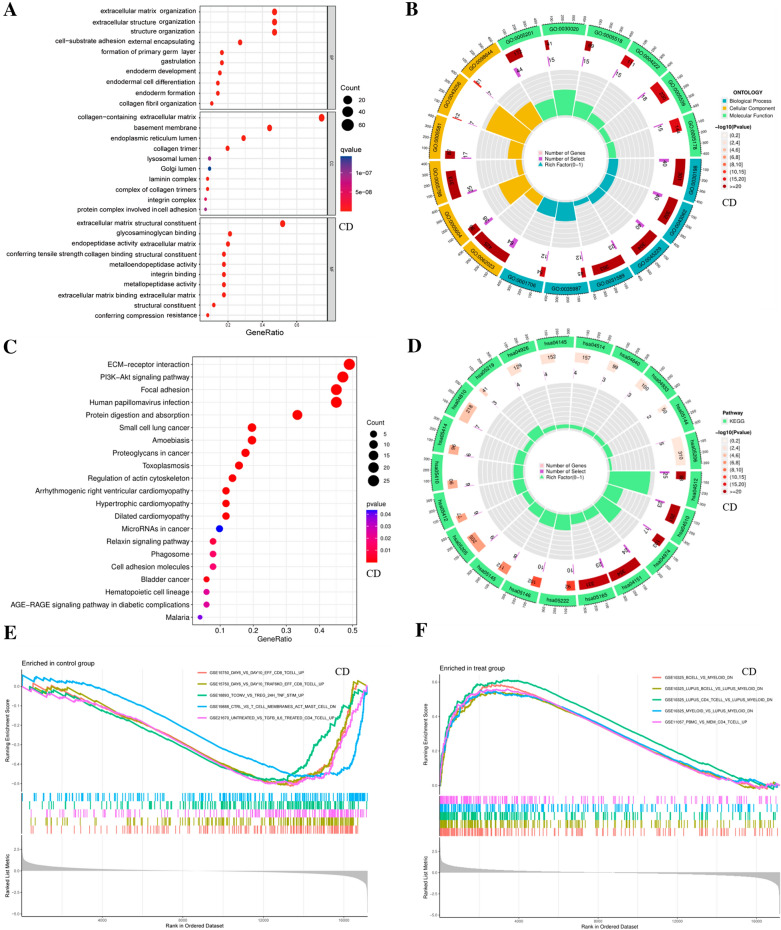
Fig. 5.
Functional analysis of DEGs. A Bubble chart of GO enrichment analysis of differential BM genes in the CD group, and the top 10 functions are listed respectively. B Circle chart of GO enrichment analysis of differential BM genes in CD group and the distribution of top 6 functions are listed respectively. C Bubble chart of differential BM genes KEGG enrichment analysis in CD group and the top 10 functional pathways are listed. D Circle plot of CD group differential BM gene KEGG enrichment analysis. E, F In the CD group analysis, GSEA analysis was performed with the immune-related gene set as a reference, and the top 5 enriched immune gene sets were listed, respectively

