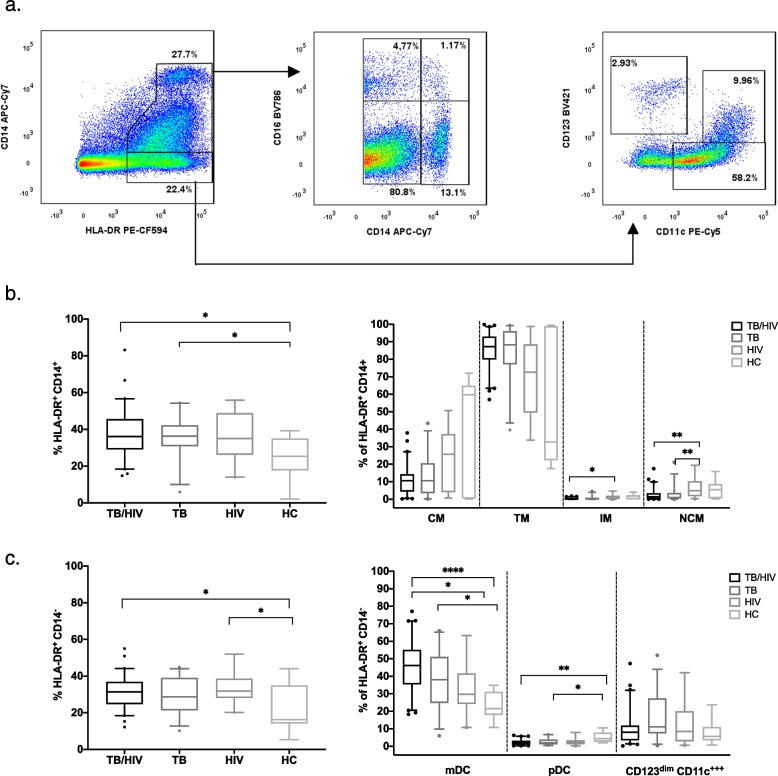
Fig. 1.
a Representative gating of HLA-DR+ CD14+ (monocyte) and HLA-DR+ CD14− (dendritic) cell populations. The staining profile of PBMCs from a representative TB/HIV co-infected participant is shown. b Differences in frequencies of total monocytes and monocyte subsets (classical, non-classical, intermediate, and transitional) between study groups (TB/HIV, TB, HIV and HC). c Differences in frequencies of dendritic cells and their subsets (mDC, pDC, and CD123dim CD11c.++) between study groups. b and c Boxes represent median and interquartile ranges; whiskers represent 5–95 percentiles. Differences in cell population frequencies among the groups were assessed using a Kruskal–Wallis test with Dunn’s post-test for data that were not normally distributed and one-way ANOVA test with Tukey’s post-test for normally-distributed data. *p < 0.05; ** p < 0.01 and ****p < 0.0001

